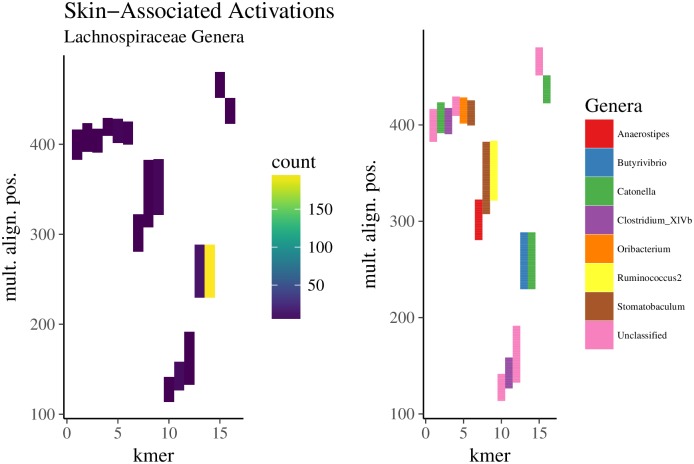
Fig 8. Regions within Lachnospiraceae reads among in which skin-associated k-mers mapped.
The top-1000 k-mers with the largest activations (the linear combination of the k-mer embedding and regression coefficients obtained via lasso) for skin were identified. A random sample of 25,000 reads (from skin samples) containing these k-mers underwent multiple alignment. Shown is the relative position of k-mers found only in Lachnospiraceae reads from skin samples. The position of a given k-mer in the alignment spans its entire starting and ending position, including gaps. The frequency in which these k-mers mapped to positions (left column) in the multiple alignment were quantified (y-axis). The order of the k-mers in the heatmap (x-axis) was obtained via hierarchical clustering (Ward’s method) on Bray-Curtis distances. The Lachnospiraceae genus that most frequently occurred at a given alignment position for a given k-mer is colored (right column).

