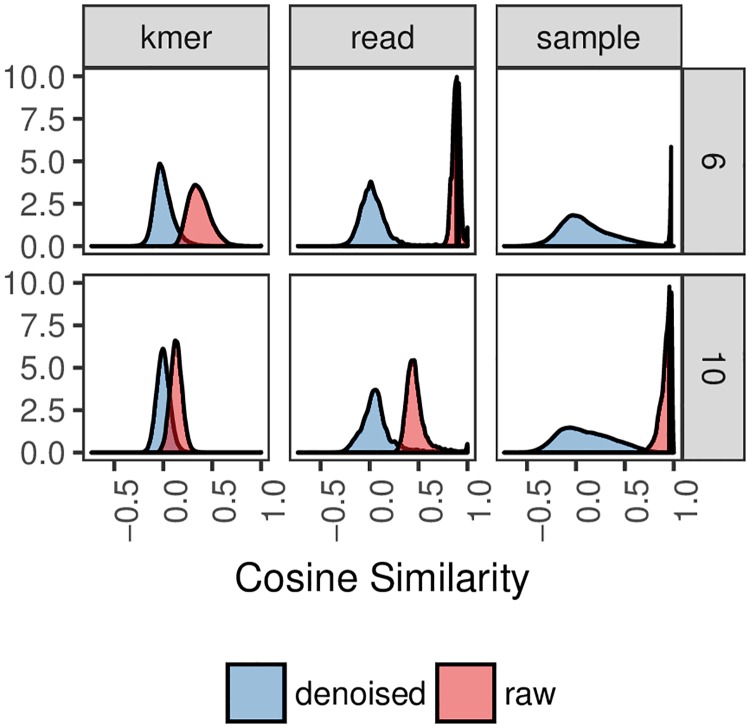
Fig 9. Distribution of pairwise cosine similarity for k-mer, sequence, and sample embeddings of the American Gut data.
Sequence and sample embeddings were calculated from 21 randomly selected (7 for each body site) samples. k-mer embeddings were those used during training with the GreenGenes sequences. Shown are distributions of pairwise cosine similarities as a function of k-mer size (rows), denoising (blue versus red), and embedding space (columns).

