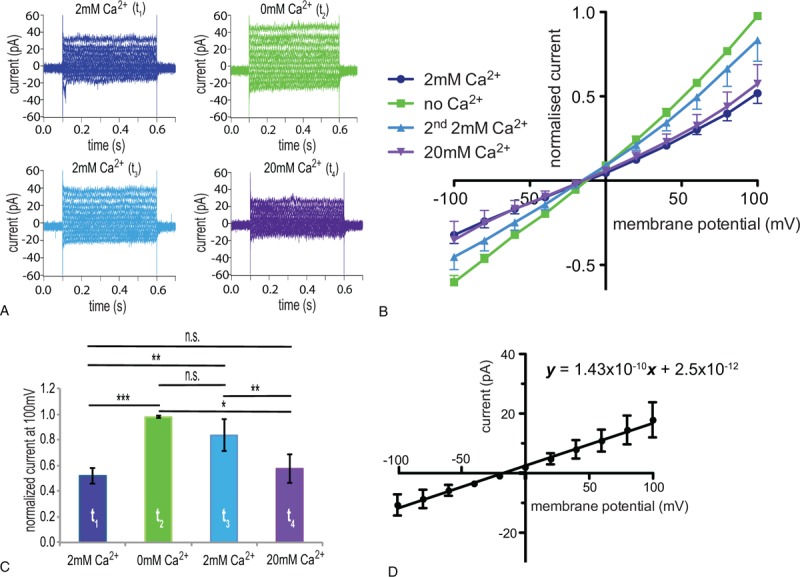
Figure 2.

Verification and further characterization in physiological solutions of a Ca2+-blocked current in RBCs of healthy adults. Whole cell patch clamp recordings in physiological (a K+-based internal and a Na+-based external) solutions. (A) Raw current traces from a representative RBC in an external solution containing 2 mM CaCl2 at t1 (dark blue), 0 mM CaCl2 at t2 (green), 2 mM CaCl2 at t3 (light blue), and 20 mM CaCl2 at t4 (violet). (B) I/V curves in 2 mM CaCl2 (t1) (dark blue), 0 mM CaCl2 (t2) (green), 2 mM CaCl2 (2nd application) (t3) (light blue), and 20 mM CaCl2 (t4) (violet)-external solutions (n = 7 (3) with n being the number of cells and in brackets the number of donors). (C) Bar chart of the normalized current at 100 mV with the successive application of 2 mM CaCl2, 0 mM CaCl2, 2 mM CaCl2, and 20 mM CaCl2-external solutions; colors match the conditions in A and B. (D) I/V curve of the Ca2+-blocked current (the current recorded in 2 mM CaCl2-external solution at t1 was subtracted from the current recorded in 0 mM CaCl2-external solution at t2 in physiological solutions). In order to determine the whole cell conductance based on the slope of the I/V curve (143 pS), the current is given in absolute values, which results, due to cell-to-cell variations, in bigger error bars (standard error of mean) compared with normalized currents. Currents were elicited by voltage steps from −100 to 100 mV for 500 milliseconds in 20 mV increments at Vh = −30 mV. Measurements were performed at room temperature. Data are presented as mean ± standard error of the mean. Significance is assessed with a paired Student t test and set at P < 0.05. Stars are used as follows: ∗∗ for P < 0.01, and ∗∗∗ for P < 0.001; n.s. stands for nonsignificant. RBC = red blood cell.
