Figure 3.

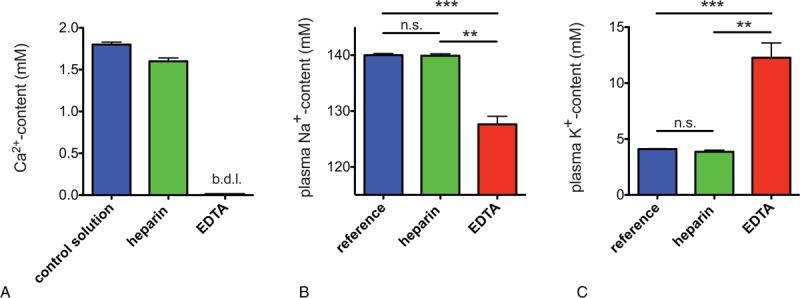
Blood plasma ion content of healthy adults in heparin and EDTA. (A) Ca2+ content of a control aqueous nonbuffered 1.8 mM CaCl2 solution filled in heparin and EDTA vacutainers. The abbreviation b.d.l. denotes “below detection limit.” (B) Na+ plasma content, (C) K+ plasma content of blood anticoagulated with heparin and EDTA. Measurements in heparin and EDTA were performed on blood of healthy adults (n = 3) collected in heparin and EDTA vacutainers, respectively, and reference values were taken from Liappis.14 Error bars represent standard error of the mean and stars denote significances as follows: n.s. for not significant, ∗∗ for P < 0.01 and ∗∗∗ for P < 0.001. It is worthwhile to mention that even though the driving force for Na+ to get into the cell was higher in heparin compared with EDTA (due to the additional Na+ coming from the Na-heparin salt itself) it was in EDTA that we detected a higher Na+ influx (lower Na+ plasma content) (B). Vice versa, even though the driving force for K+ to get out of the cell was lower in EDTA compared with heparin (due to the additional K+ coming from the K3EDTA salt itself) it was in EDTA that we detected a higher K+ outflux (higher K+ plasma content) (C). EDTA = ethylenediaminetetraacetic acid.
