
Figure 5.
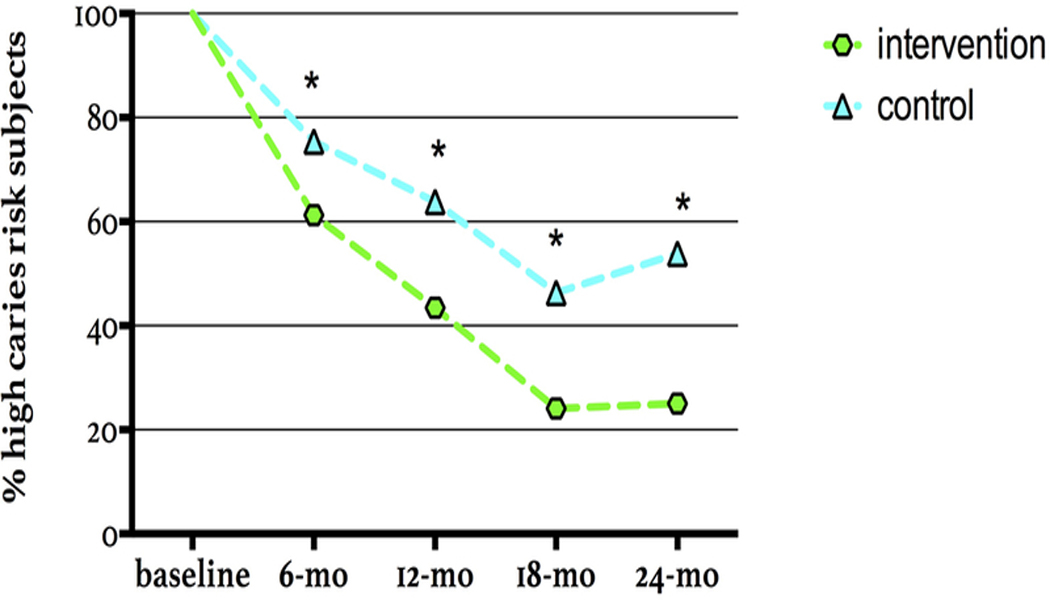
Change in caries risk levels for patients assessed as high caries risk at baseline; showing the percentage of patients staying at high risk over time for the intervention and the control group.
(* marks statistically significant difference at specific recall time point; overall significance P<0.001)