Figure 3.

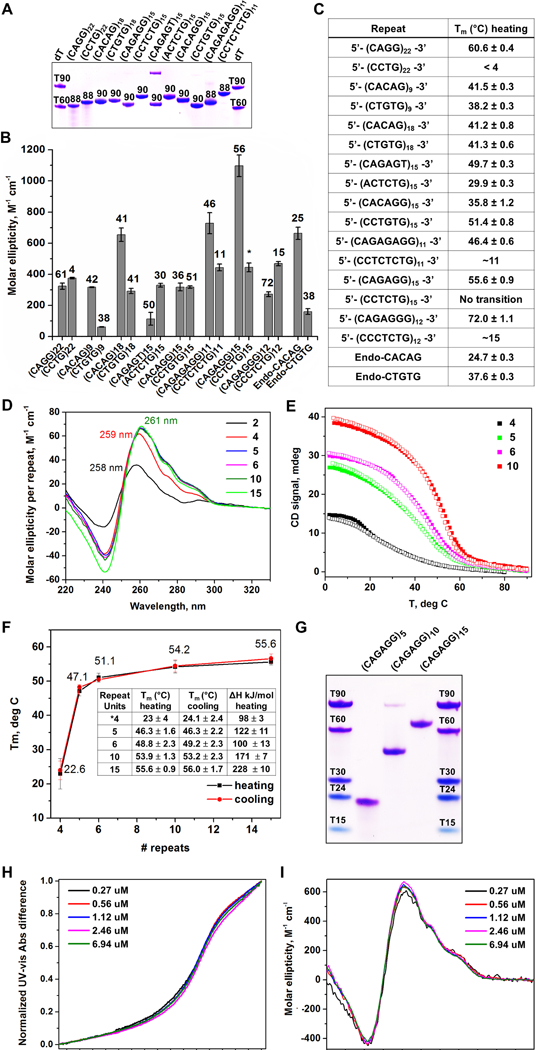
RPL-Associated Repeats Form Unique Intrastrand Secondary Structures (A) Non-denaturing PAGE gel of oligonucleotide repeats. (B) CD molar ellipticity peak values as a proxy for DNA folding. Melting temperatures, shown above bars, were obtained using a non-linear fit assuming two-state system. (*) indicates melting transition is characterized by a non-sigmoidal melting curve. (C) List of simple repeat sequences analyzed and respective melting temperatures. (D) Repeat-normalized CD wavelength scans of (CAGAGG)n, with n = 2, 4, 5, 6, 10, and 15. (E) Representative CD melting and cooling curves for (CAGAGG)n, n = 4, 5, 6, and 10. (F) Graph of melting temperatures obtained by UV-vis with different CAGAGG monomer lengths. Tm values and change in enthalpy are summarized in the embedded table. (G) Non-denaturing PAGE gel of (CAGAGG)n, n = 5, 10, and 15. Overlay of (H) normalized UV-vis melting and (I) CD scans (4°C) of (CAGAGG)10 at varying oligonucleotide concentrations. For (B), the data are represented as mean +/− SEM. For (A-I), all samples were prepared in 10 mM lithium cacodylate pH 7.2, 100 mM KCl and 2 mM MgCl2 buffer. For (A) and (G), DNA bands were visualized with Stains All. See also Supplemental Fig. S4and Table S3.
