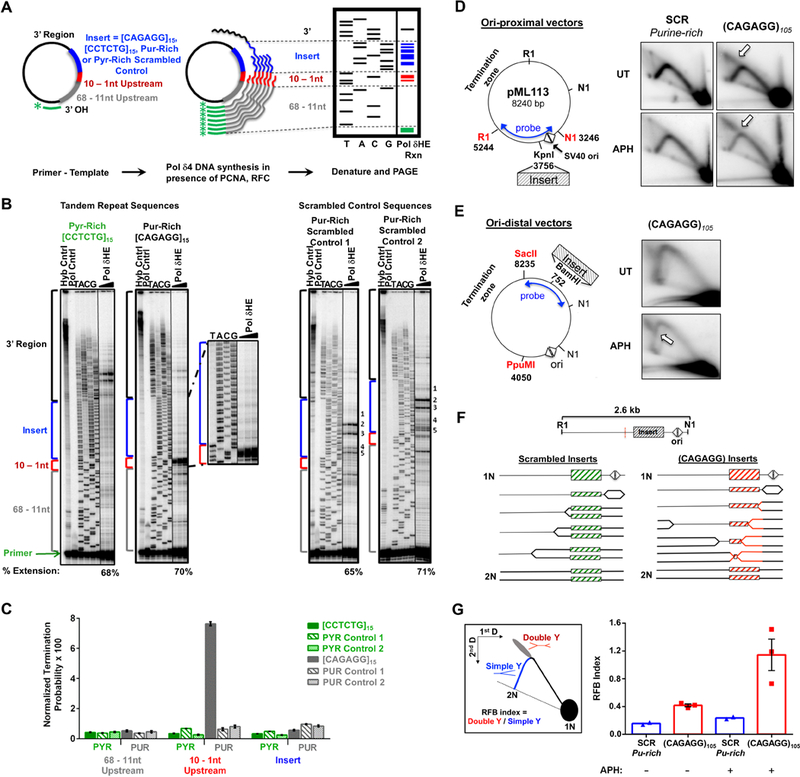
Figure 4.

CAGAGG Repeats Impede DNA synthesis (A) Schematic of in vitro Pol δHE primer-extension assay. (B) Representative images of Pol δHE reaction products. Pol δHE DNA synthesis products from ssDNA templates containing (CAGAGG)15, (CCTCTG)15, or scrambled control inserts (purine-rich or pyrimidine-rich) with increasing reaction times (3 – 15 minutes, triangle) were separated by denaturing PAGE alongside a dideoxynucleotide sequencing of the same template (TACG). Left: (CCTCTG)15 and (CAGAGG)15 insert-containing templates; Right: two distinct purine-rich scrambled control insert-containing templates. Control lanes are indicated (-Pol, No Polymerase; Hyb, Primer-template hybridization). Percent Extension, extended DNA over extended plus unextended primer-bound DNA. Also see Supplemental Figure S5A for pyrimidine-rich scrambled control. (C) Pol δHE termination probability. Termination probability, normalized by the number of nucleotides in each region, was quantified as the ratio of DNA molecules within a specific region over these plus all longer DNA molecules. (D) Effect of (CAGAGG)n repeats on plasmid DNA synthesis in cells. Left: (CAGAGG)105 or a scrambled sequence of the same nucleotide composition and length (SCR) was inserted proximal to the bidirectional SV40 origin (triangles) SV40 large T-antigen (TAg) (Follonier et al., 2013). Right: Representative 2D gels. Plasmid transfected cells were either untreated (UT) or treated with 0.6 μM aphidicolin (APH) for 24 hours. Isolated episomal DNA was digested with DpnI, EcoRI (RI) and Eco NI (NI) and replication intermediates were resolved by 2D neutral-neutral gel electrophoresis with Southern hybridization to the indicated probe. Arrows denote the point of divergence of the double-Y structure from the simple-Y arc. (E) Replication intermediates of plasmids containing origin-distal (CAGAGG)105. Left: Schematic of the ori-distal vectors(2.7 kB from the origin). Right: Representative 2D gels. Experiment was carried out as described in (A), except that the purified DNAs were digested with DpnI, PpuMI, and SacII and detected with the indicated probe. (F) Schematic of replication through ori-proximal vectors and the formation of double-Y structures. Dashed red line indicates the center of the RI-NI fragment, the expected apex of the simple-Y arc. (G) Left: Schematic of replication fork barrier (RFB) index quantitation. The RFB index is the number of double Y structures (red) divided by the number present in >1.5N simple-Y structures (blue). Right: Quantitation of the RFB index in CAGAGG)105 and SCR ori-proximal vectors from 2D gels (E). For (C), the data are represented as mean +/− SEM of three independent polymerase reactions for each template. ****, p < 0.0001. For (G), the data are represented as mean +/− SEM, with individual data points representing independent biological replicates. See also Figure S5.
