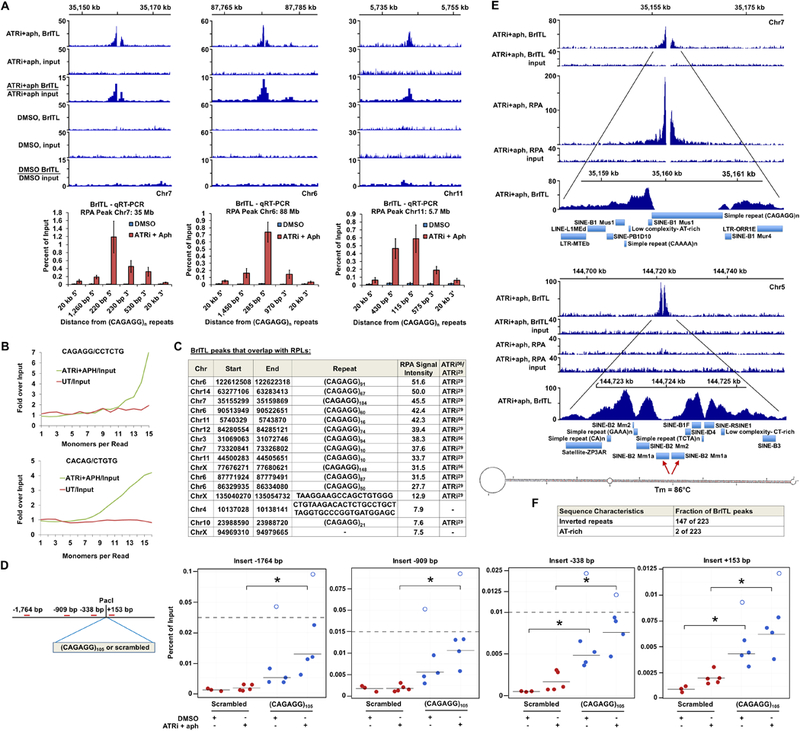
Figure 6.

BrITL Sites Overlap with RPLs and Inverted Repeats (A) Top: Coverage and ratio tracks of BrITL retrievals and inputs of ATRi+aph18hrs and DMSO- treated cells at RPLs. Bottom: BrITL-qRT-PCR detection of RPL sites adjacent to peak-centric (CAGAGG/CCTCTG)n repeats. (B) Quantification of total repeat units in BrITL retrieval reads by REQer. X-axis depicts the total repeat units counted within the total BrITL reads (ATRi+aph18hrs and DMSO control, UT) normalized by repeat occurrence in respective inputs. (C) Table listing RPLs that overlap with BrITL peaks and the repeats associated with these sites. (D) Left: Schematic of (CAGAGG)105-containing vector for stable genomic integration and primer sets used in BrITL qRT-PCR analysis. Right: qRT-PCR analysis of genomic BrITL retrievals (ATRi+aph18hrs and DMSO control, UT) at indicated distances from the (CAGAGG)105 and 630 bp scrambled control insertion sites. Data points represent independent biological replicates; red: scrambled 630 bp insert; blue: (CAGAGG)105 insert. Hollow dots represent outliers. *, p < 0.05, Student’s T-test. (E) Representative coverage tracks of RPA-ChIP and BrITL retrievals and inputs at RPA-positive and RPA-negative BrITL sites following ATRi+aph18hrs. RepeatMasker annotations of repetitive elements as well as a representative inverted retroelement repeat and its M-fold-predicted stem-loop structure are shown below. (F) Inverted repeat and AT-rich sequence frequency in ATRi+aph18hrs BrITL peaks. For (A), the data are represented as mean +/− SEM. See also Figures S6 and S7 and Supplemental Table S4 and S5.
