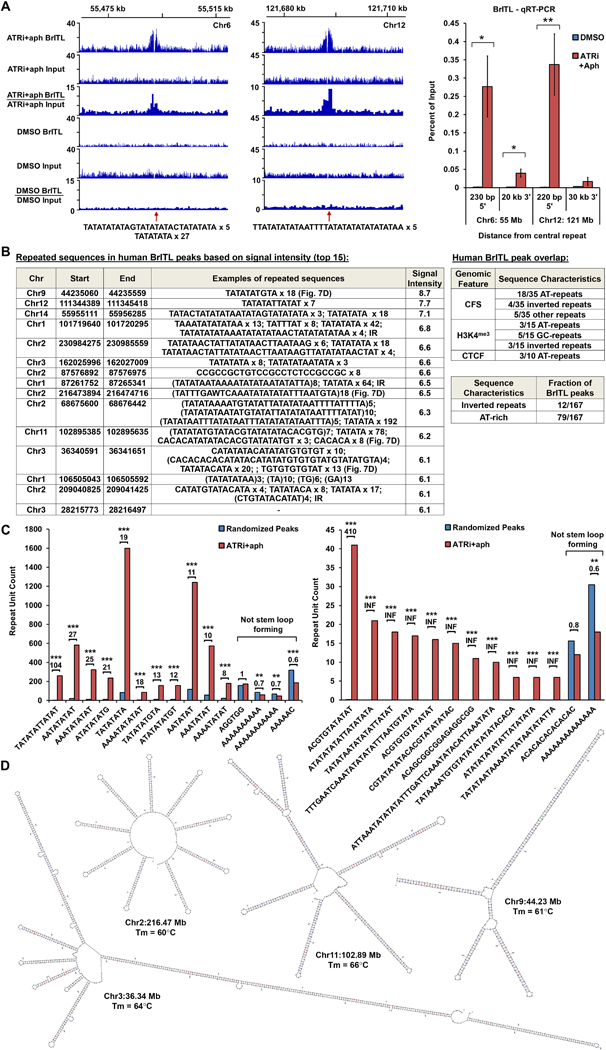
Figure 7.

ATRi-Driven Breakage in Human Cells is Associated with Structure-Forming Repeats. (A) Left: Coverage tracks of BrITL retrievals and inputs from ATRi+aph9hrs and DMSO-treated cells. Right: qRT-PCR analysis of BrITL retrievals at specified distances from central AT-rich repeats. *, p < 0.05; **, p < 0.002. (B) Left: Top 15 ATRi+aph9hrs BrITL peaks and associated repeats. Right: Repeat sequences observed in ATRi+aph9hrs BrITL peaks that overlap with specific genomic features. Bottom right: Fraction of ATRi+aph9hrs BrITL peaks associated with inverted repeats or AT-rich repeats. (C) Bar graphs quantifying repeat motifs identified by MISA and HOMER2 within ATRi+aph9hrs BrITL peaks and randomly generated pseudo-peaks of similar size. *, p < 0.002; **, p < 0.0001; ***, p < 0.000001. (D) M-fold-predicted structures and Tm of notable AT-rich repeats in BrITL peaks. For (A), the data are represented as mean +/− SEM. See also Supplemental Table S6 and S7.
