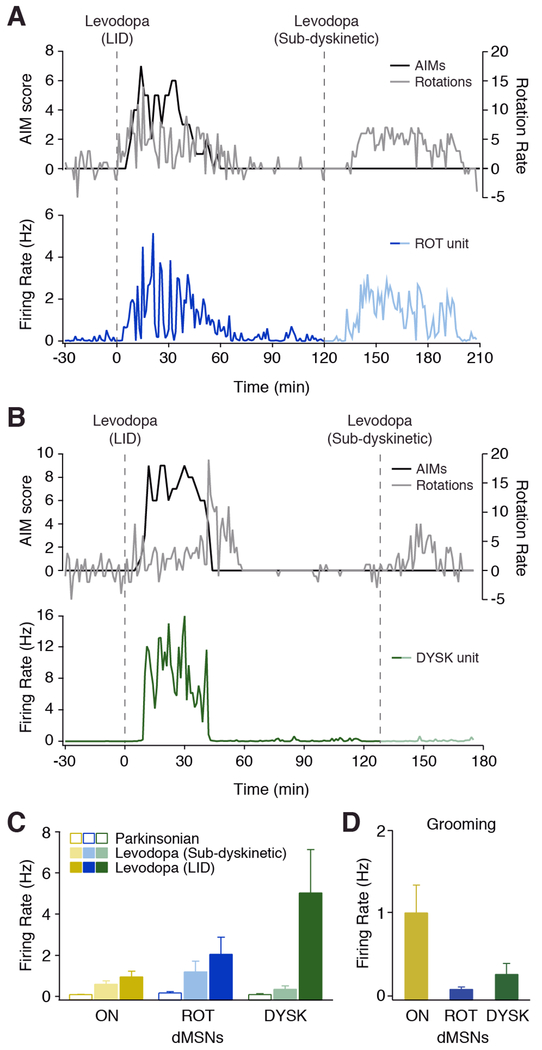
Figure 4. DYSK Unit Activity is Specific to LID.
(A-B) Two doses of levodopa were administered in a single session. Top: dyskinesia score (black) and rotation rate (gray). Bottom: unit firing rate, aligned to levodopa injection (dotted line). Representative (A) ROT unit and (B) DYSK unit. (C) Average firing rate of putative dMSN subtypes before (parkinsonian) and after dyskinetic and sub-dyskinetic doses of levodopa. ON: n=14, N=4; ROT: n=8, N=3; DYSK: n=8, N=3. (D) Average firing rate of putative dMSN subtypes during grooming (ON: n=30, N=4; ROT: n=5, N=2; DYSK: n=44, N=5). n=cells, N=animals. All data presented as mean ± SEM. See also Movie S3 and S4.

