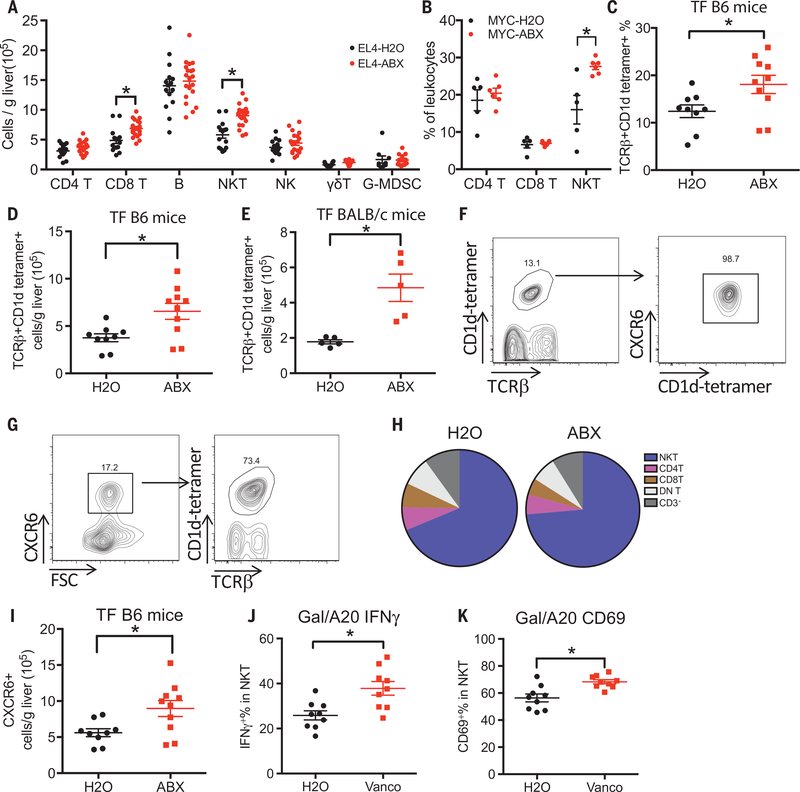
Fig. 2. Hepatic NKT cells increase after depleting gut commensal bacteria.
(A) ABX- or H2O-pretreated C57BL/6 mice were given subcutaneous EL4 tumor injection. Two and a half weeks later, liver infiltrating immune cells were measured. Data represent mean ± SEM of three pooled experiments. n = 15 for EL4-H2O, 20 for EL4-ABX. P < 0.05, two-way analysis of variance (ANOVA). (B) Hepatic NKT, CD4, and CD8 T cell levels of MYC mice described in Fig. 1A. Data represent mean ± SEM of two pooled experiments. P < 0.05, two-way ANOVA. (C and D) Hepatic NKT cells in tumor-free C57BL/6 mice were fed with ABX or H2O. Data represent mean ± SEM of two pooled experiments. n = 9 for H20,10 for ABX. P < 0.05, Student’s t test. (E) Hepatic NKT cells in tumor-free BALB/c mice fed with ABX or H2O. Data represent mean ± SEM of two pooled experiments. n = 5, P < 0.05, Student’s t test. (F) Representative CXCR6 staining in hepatic NKT cells from three independent experiments. (G) Representative NKT cell staining in CXCR6+ liver infiltrating mononuclear cells from three independent experiments. (H) Composition of CXCR6+ liver infiltrating mononuclear cells in tumor-free C57BL/6 mice fed with ABX or H2O. DN T: double negative T cells. Data represent pooled results from three experiments. (I) Levels of CXCR6+ liver-infiltrating cells in tumor-free C57BL/6 mice fed with ABX or H2O. Data represent mean ± SEM of two pooled experiments. n = 9 for H20,10 for ABX. P < 0.05, Student’s t test. (J and K) IFN-γ and CD69 levels of hepatic NKT cells after in vivo stimulation by injecting aGalCer-loaded A20 tumor cells (Gal/A20) into vancomycin (Vanco) or H2O-fed BABL/c mice. Data represent mean ± SEM of two pooled experiments. n = 9, P < 0.05, Student’s t test.

