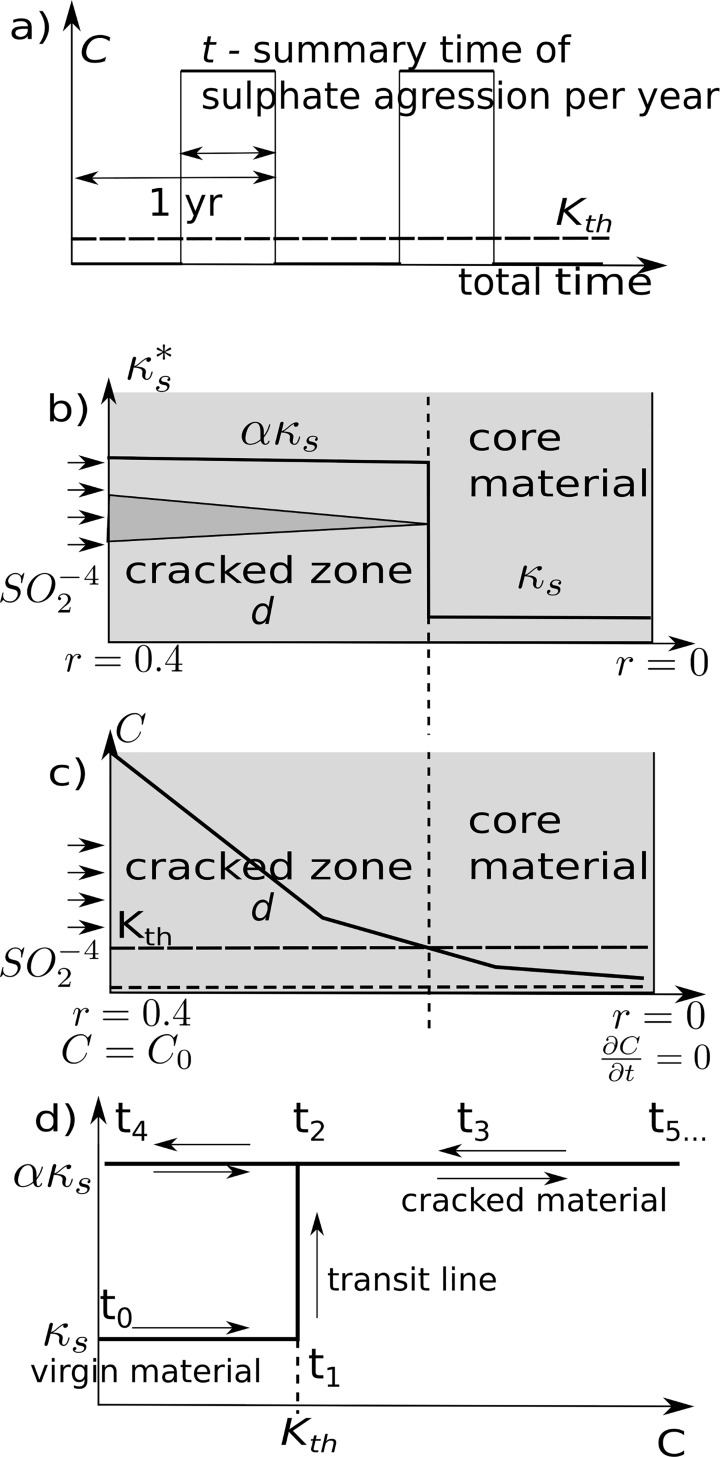
Fig 4.
a) Boundary periodic load—ionic concentration was modelled as a periodic and discrete distribution; b) The area in which the concentration exceeds the threshold Kth is considered to be destroyed; c) Sketch of ionic concentration in the material with the boundary conditions; d) Path changes chart of the coefficient ks with a specified hysteresis in time.

