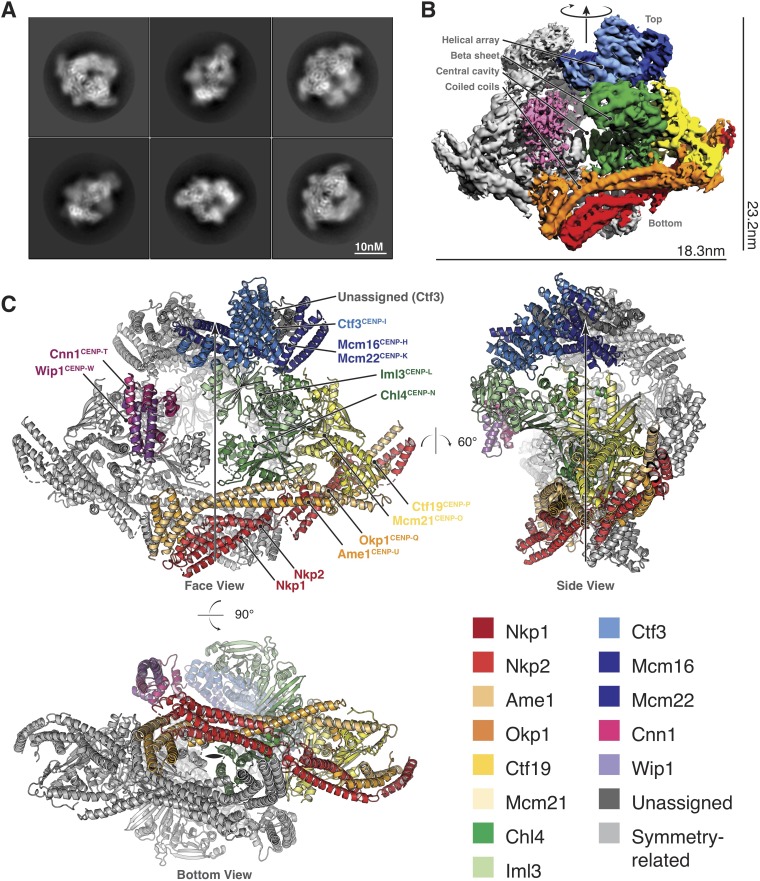
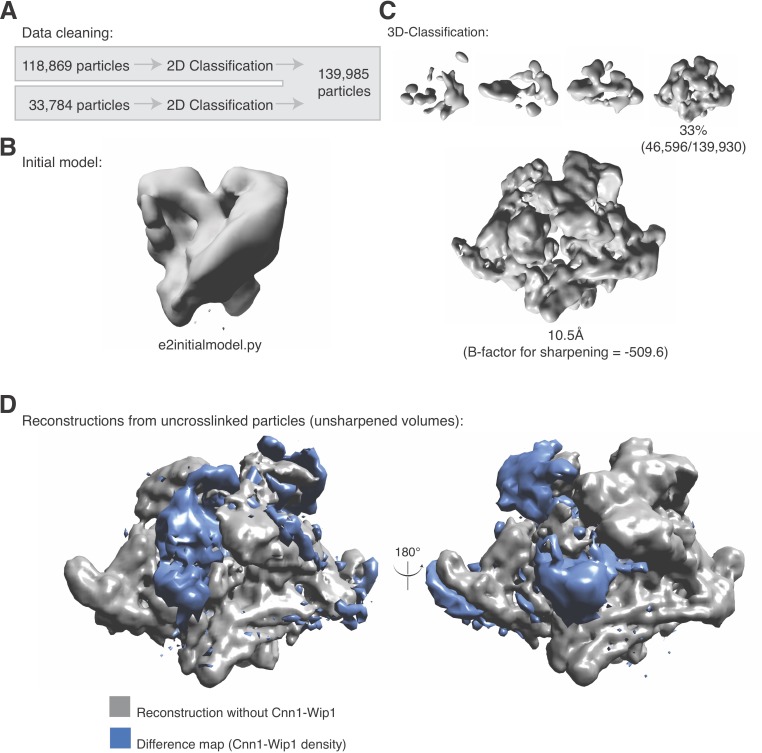
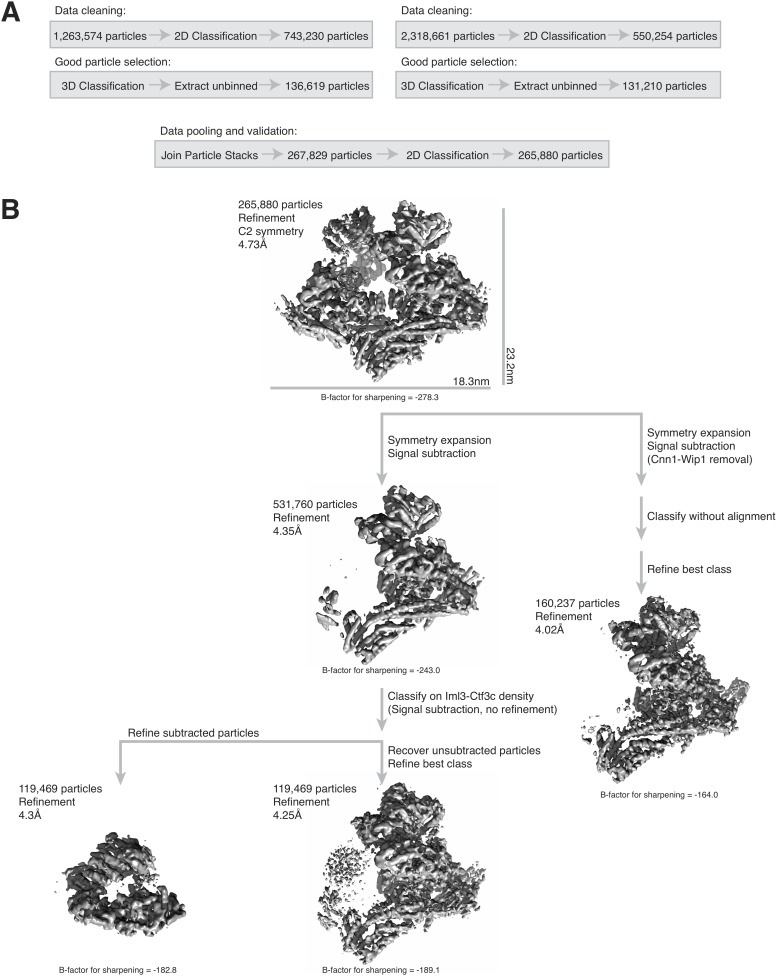
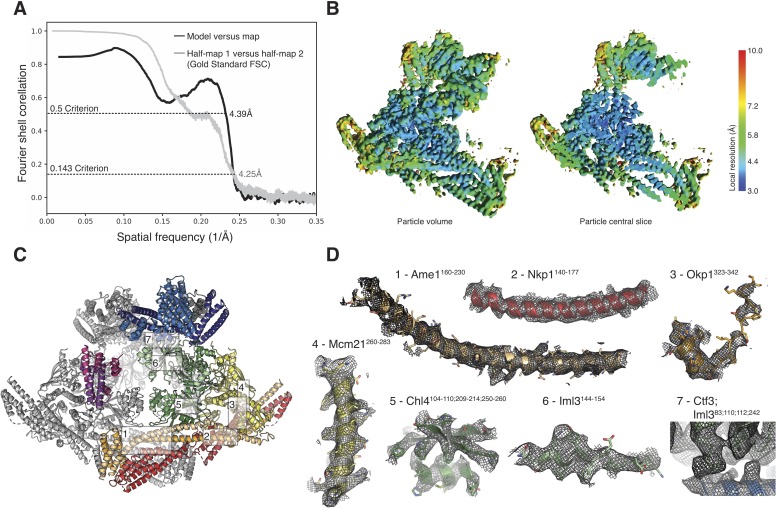
Figure 2. Structure determination and model of the Ctf19c.
(A) Two-dimensional class averages showing various Ctf19c projections. (B) Initial Ctf19c density map with twofold symmetry applied. (C) Molecular model of the Ctf19c. The twofold symmetry axis is marked by an arrow. Subunits from one monomeric assembly are colored according to their identities. Those related by twofold symmetry are colored gray. The face view corresponds to the orientation shown in panel B.


