
Figure 3.
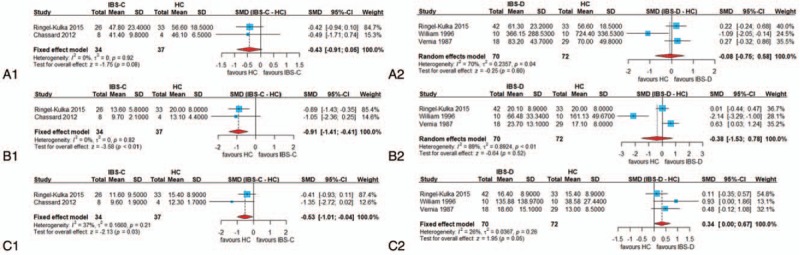
Forest plots of alterations of fecal short-chain fatty acids concentration in patients with different subtypes of irritable bowel syndrome (IBS) versus healthy controls (HC): (A-1) acetate in constipation-predominant irritable bowel syndrome (IBS-C) vs HC, (A-2) acetate in diarrhea-predominant irritable bowel syndrome (IBS-D) vs HC, (B-1) propionate in IBS-C vs HC, (B-2) propionate in IBS-D vs HC, (C-1) butyrate in IBS-C vs HC, and (C-2) butyrate in IBS-D vs HC. CI = confidence interval, SMD = standardized mean difference