Figure 1.

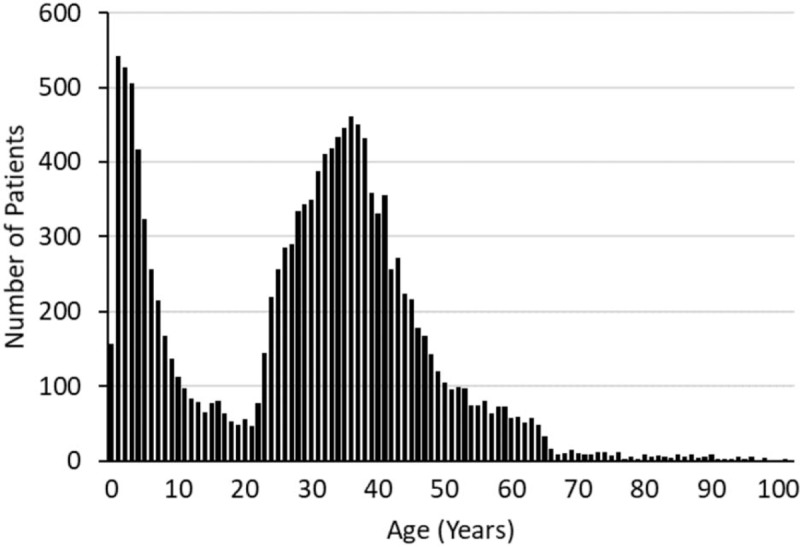
Histogram plot of patient age distribution. House calls to 13,849 patients made between August 2016 and July 2017 were analyzed for frequency of patient age.

Histogram plot of patient age distribution. House calls to 13,849 patients made between August 2016 and July 2017 were analyzed for frequency of patient age.