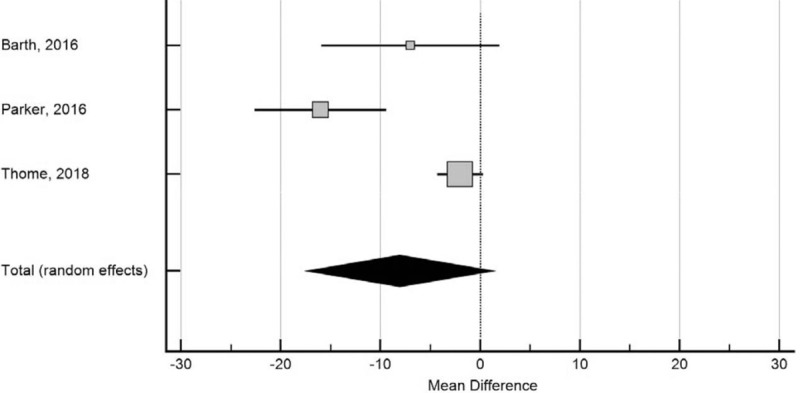
Figure 5.

Forest plot of disability after lumbar discectomy with bone-anchored annular closure versus lumbar discectomy. The mean difference and 95% confidence interval is plotted for each study. The pooled mean difference (diamond apex) and 95% confidence interval (diamond width) is calculated using a random effects model. Positive pooled mean difference suggests greater disability with bone-anchored annular closure. Negative pooled mean difference suggests less disability with bone-anchored annular closure. Mean difference −8, P = .09. Heterogeneity: I2 = 87%; P < .001.
