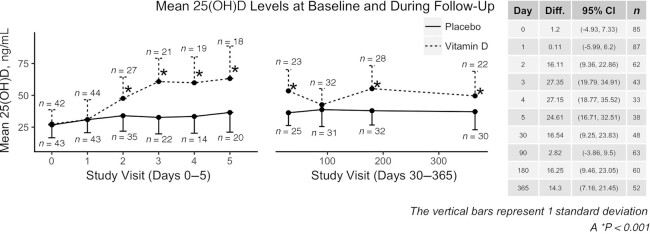
FIGURE 4.
Mean 25-hydroxyvitamin D concentrations in the vitamin D and placebo groups. Serum 25(OH)D concentrations in the group randomly assigned to vitamin D (dotted line) were significantly higher than in the placebo group (solid line) at days 1–7 and at 1, 6, and 12 mo in a mixed-effects regression analysis. Each point on the plot is the estimated group mean at that time point, and the vertical bars correspond to 1 SD. The sample size at each time point is reported near the error bar. 25(OH)D, 25-hydroxyvitamin D.

