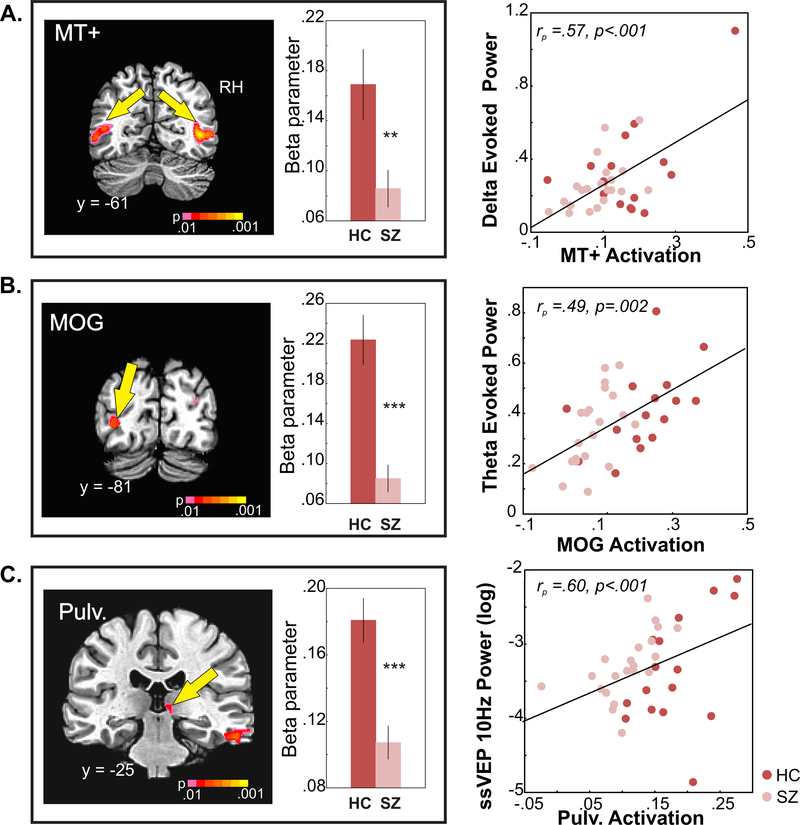
Figure 3: fMRI measures of motion perception.
A. MT+ activation. ROIs in middle temporal cortex corresponding to MT+ ( RH is on the right) and bar graphs are of mean activation (beta parameter) elicited by the contrast of moving vs. static across hemispheres in SZ and HC groups. Reduced MT+ activation correlated with diminished delta power (low SF low contrast stimuli) to motion onset (scatterplot on right).
B. MOG activation. Mean activation of MOG (LH) and correlation with diminished mean theta power in response to stimulus onset.
C. Pulvinar activation. Mean pulvinar (RH) activation and correlation with ssVEP power at 10Hz.

