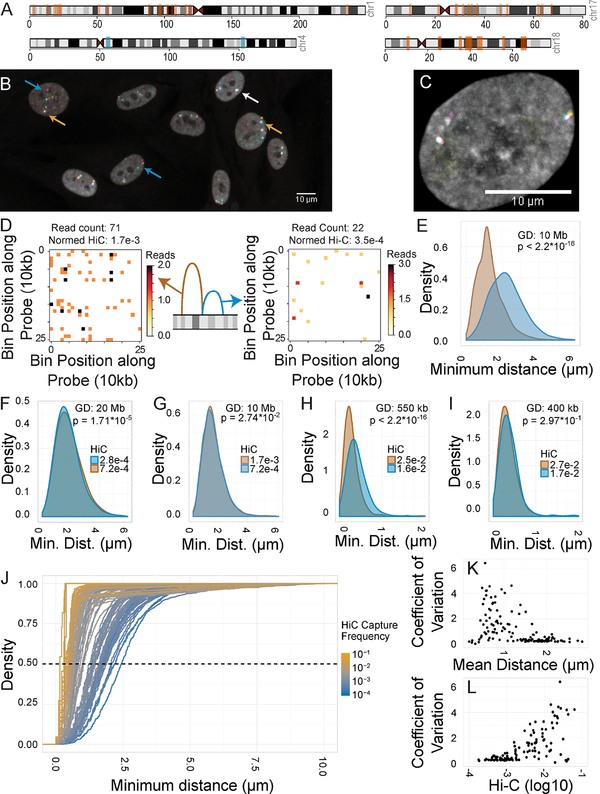
Figure 1: Spatial mapping of genome interactors.
A: Ideogram of loci used for spatial mapping. Orange bars: long-range sites. Blue bars: tiled regions. B: FISH image HFFs stained for three loci on chromosome 1. Blue arrows: spots separated by large distances. White arrow: all spots colocalized. Orange arrows: two of three spots colocalized. C: FISH image of an HFF stained for three loci on chromosome 4. D: Schematic diagram and Hi-C maps of “interactor” and “non-interactor”. E: 3D distance distributions minimal distances between “interactor” (brown) and “non-interactor” (blue). F-I: Distance distributions for distance-matched regions. 2D distances are used in panels H and I. J: Cumulative distance distributions for all tested pairs. Dashed line: median (50% total density). K-L: Coefficient of variation of spatial distance vs. Hi-C frequency or mean spatial distance for all 125 pairs.

