
Figure 2: Correlation between Hi-C, genomic distance, and colocalization.
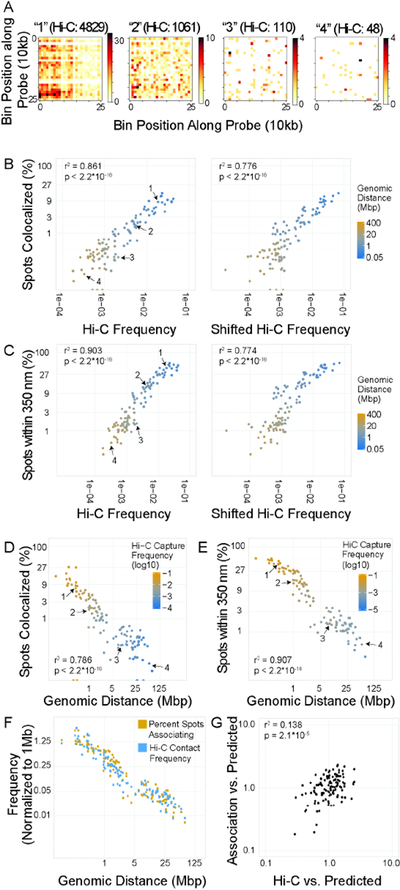
A: 10 kb resolution Hi-C maps of 250×250 kb regions centered on four interactions with variable Hi-C frequencies. These pairs are marked as 1–4 in subsequent scatter plots. B, C: Scatter plot of percentage of spot pairs with measured 3D distance = 0 (B) or < 350nm (C) vs. Hi-C frequency or shifted Hi-C frequency. D, E: Scatter plot of percentage of spot pairs with measured 3D distance = 0 (D) or < 350nm (E) vs. genomic distance. F: Scatterplot of enrichment of percent spots associating or Hi-C capture frequency vs. 1 Mb average for each site pair vs. genomic distance. G: Scatterplot of values normalized by distance-based predictions. Predicted values were generated based on a single power law model, and the ratio between predicted and observed value was used.