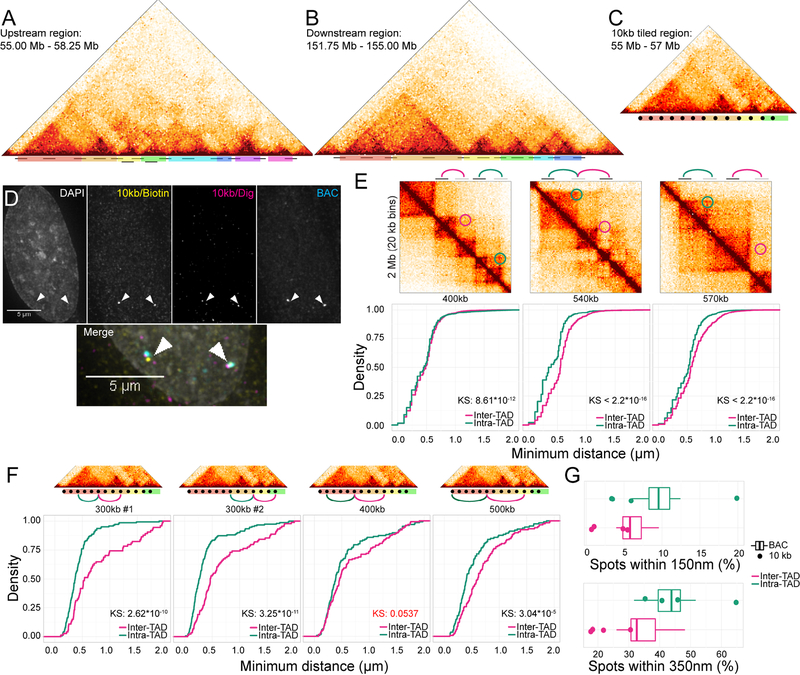
Figure 4: Enrichment of Intra-TAD interactions.
A-C: Hi-C plots showing regions tiled with location of probes marked (black bars) and TADs color-coded. D: FISH image using 10 kb probes and positive control BAC. E: Hi-C snapshots and distance distributions for distance matched interaction pairs between and within TADs, as measured by BAC probes. F: As in E, but with 10 kb probes. Non-significant p-value marked in red. G: Box plots showing distribution of percent spots within 150 or 350 nm. Boxes: BAC probes, points: 10 kb probes.

