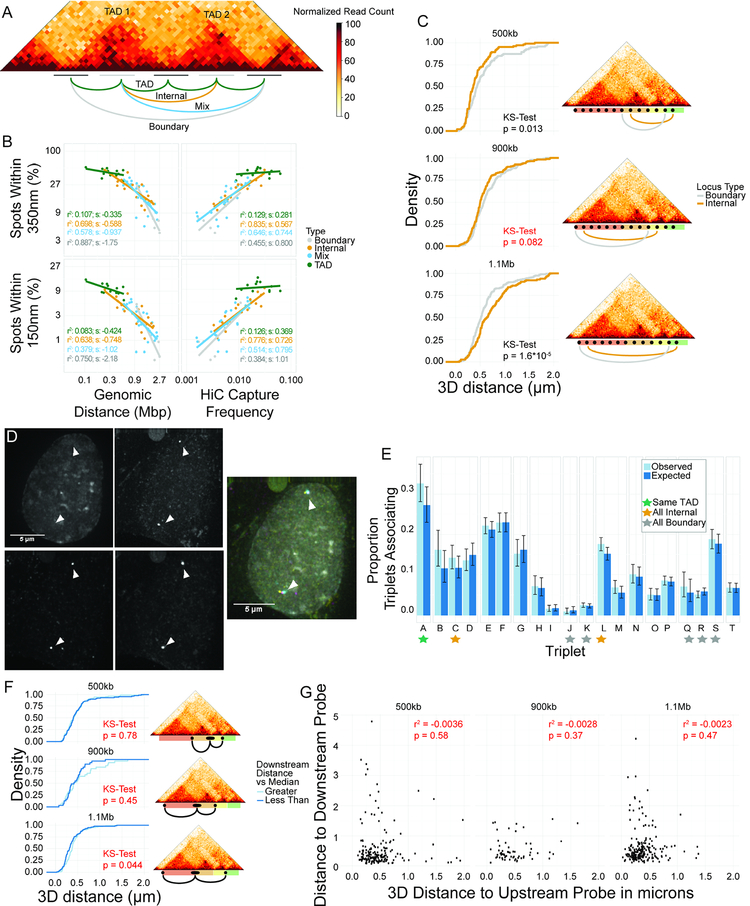
Figure 5: Neighboring and nearby TADs associate at internal regions, not boundaries.
A: Diagram of four classes of interactions. B: Scatterplots of percentage of spot pairs within 350 nm (top panels) or 150 nm (bottom panels) vs. either genomic distance (left panels) or Hi-C capture frequency (right panels). C: CDFs of 3D distances for boundary element association and internal region association using 10 kb probes. Non-significant p-value in red. D: Representative image of tight colocalization of BAC probe and two 10 kb probes. E: Barplot of proportion of triplet clusters (colocalization of all three probes) vs. expected numbers based on an assumption of statistical independence between pairwise interactions. Triplet IDs in Table S3. F: CDFs of distance distributions for upstream 10kb probes, classified based on distance from BAC to downstream 10kb probe. Downstream probe farther than median: light blue. Downstream probe is closer than median: dark blue. Maps at the right show location of probe pairs tested. Non-significant p-values in red. G: Scatterplots showing lack of correlation between distance to upstream and downstream 10kb probes.

