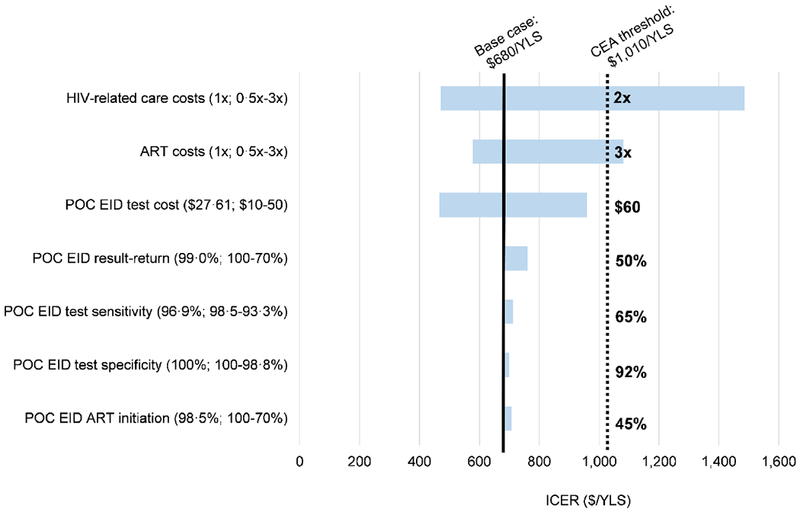
Figure 2. Tornado diagram: key parameters and thresholds that change the cost-effectiveness of POC EID compared to conventional EID.

Key parameters varied in one-way model sensitivity analyses are shown on the left. Values in parentheses indicate the range examined (from the value leading to the lowest ICER to the value leading to the highest ICER with base case values before the semicolon). ICERs for the comparison of POC EID vs. conventional EID are shown on the horizontal axis, in 2016 USD/YLS. The range of ICER values for each varied parameter is indicated by the blue horizontal bars; longer bars indicate parameters to which the model results were more sensitive. The solid, black vertical line indicates the ICER for POC EID vs. conventional EID using all base case parameters ($680/YLS). The dotted, black vertical line indicates Zimbabwe’s 2016 annual per capita GDP cost-effectiveness threshold ($1,010). The value for each parameter at which the ICER of POC EID vs. conventional EID crosses the cost-effectiveness threshold is shown to the right of the black, dotted vertical line.
Abbreviations: CEA: cost-effectiveness analysis; ICER: incremental cost-effectiveness ratio; POC: point of care; EID: early infant HIV diagnosis; USD: United States dollar; YLS: year of life saved; GDP: gross domestic product.
