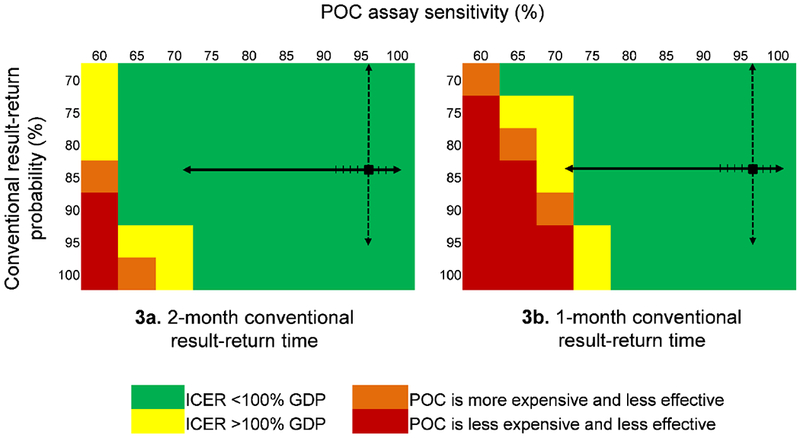
Figure 3. Effect of varying POC EID assay sensitivity and conventional EID result-return probability on the ICER of POC EID vs. conventional EID.

The cost-effectiveness of POC EID changes when POC assay sensitivity, on the top horizontal axis, and the probability of receiving a conventional EID test result, on the vertical axis, are varied simultaneously. In each panel, the black square marks the base case value in the upper right. The solid black arrows on each panel indicate the range of reported POC assay sensitivities: the lowest reported value, 71·9%, is from a p24 antigen POC assay;33 all reported POC PCR assay sensitivities are >93% (hash marks on solid black line).21 The dashed black arrows indicate the range of reported conventional result-return probabilities. Green cells indicate where the ICER of POC EID vs. conventional EID is <100% of Zimbabwe’s annual per capita GDP ($1,010). Yellow cells indicate where the POC EID vs. conventional EID ICER exceeds the $1,010 cost-effectiveness threshold. Orange cells show where POC EID is more expensive and less clinically effective than conventional EID, and red cells show the range over which POC EID is less expensive, but also less effective than conventional EID. The green cells indicate where POC EID is the preferred strategy, and yellow, orange, and red cells indicate where conventional EID is the preferred strategy. The left panel (3a) shows how varying POC assay sensitivity and conventional result-return probability affect policy conclusions when conventional EID result-return time is 2 months; the right panel (3b) shows this same analysis when conventional EID result-return time is 1 month.
Abbreviations: POC: point-of-care; ICER: incremental cost-effectiveness ratio; GDP: gross domestic product.
