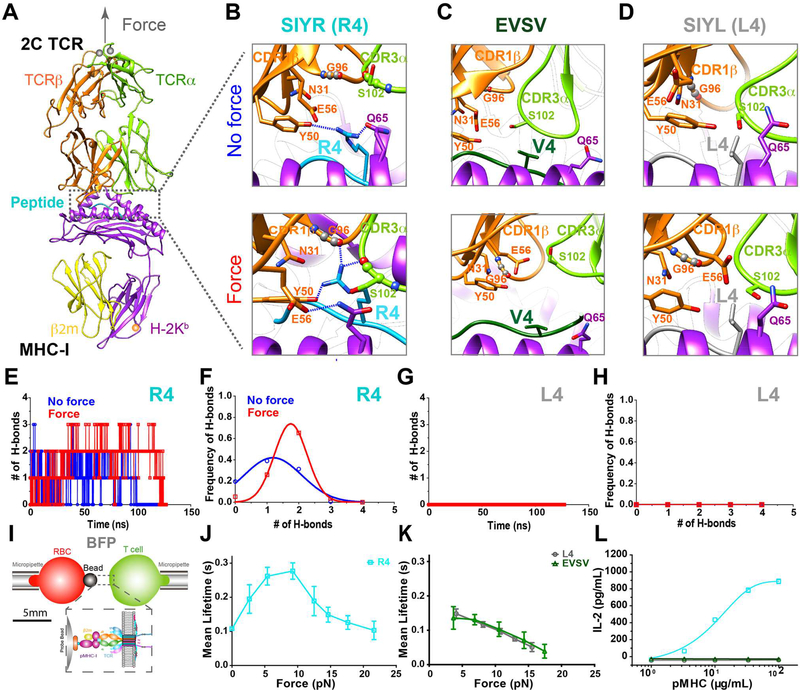
Figure 1. Force-induced strong engagement between agonist peptide and TCR determines pMHC/2C TCR catch bonds and 2C T cell responses.
(A) In SMD simulations, force was applied along the longitudinal axis (gray arrow) of the 2C TCR/R4-MHC complex to simulate BFP experiments. (B-D) Structural comparisons of the H-bond network in the vicinity of the 4th residue of the peptides R4 (B), EVSV (C) or L4 (D), at the TCR/pMHC binding interface under force or no force. Defined H-bonds are indicated as dashed blue lines. (E-H) Time-courses of the numbers of H-bonds for R4 (E) and L4 (G), and their occuring frequencies for R4 (F) and L4 (H). (I) Schematics of BFP experiments. (J-K) Force-dependent lifetimes of single TCR bonds with R4- (J), L4-, or EVSV-MHCs (K). (L) IL-2 productions of 2C T cells stimulated with serial concentrations of surface-coated R4-, L4- or EVSV-MHC. Error bars in (J-L) represent SEM. See also Figure S1.

