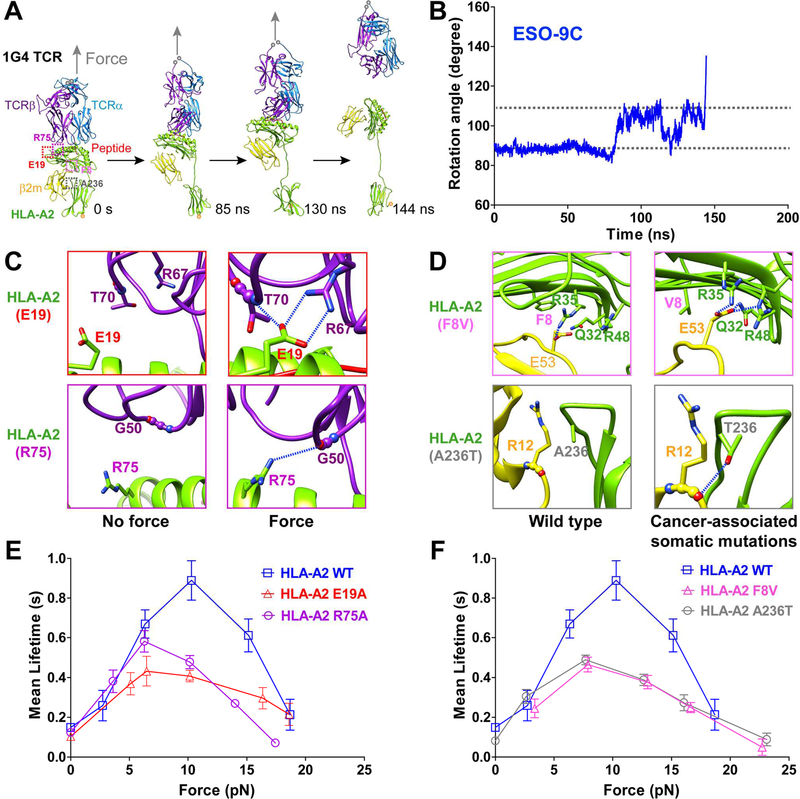
Figure 5. Force-induced MHC conformational changes and TCR-pMHC catch bonds are conserved in human TCR binding with pHLA-A2, and TCR-pMHC catch bonds are suppressed by cancer-associated somatic mutations on HLA-A2.
(A) SMD simulations of 9C-HLA-A2 in complex with 1G4 TCR showed focrce-induced MHC conformaitonal changes. (B) The time course curve of the angle between the peptide and the direction of force in SMD simulations. (C) Representative snapshots for H-bonds between TCRβ R67, T70 and MHC E19 (top), between TCRβ G50 and MHC R75 (bottom) under force and no force, zoomed in from purple and red dashed box respectively in (A). (D) Cancer-associated somatic mutations (A236T and F8V in HLA-A2) induce H-bonds or salt bridges between α and β2m subunits, zoomed in from magenta and gray dashed box respectively in (A). H-bonds are indicated as blue-dashed lines. (E-F) Force-dependent lifetimes of WT, simulation-predicted mutatnts (E19A or R75A) (E), or cancer-associated mutants (F8V or A236T) (F) of 9C-HLA-A2 binding with 1G4 TCR by the BFP. Error bars represent in (E and F) SEM. See also Figure S5.

