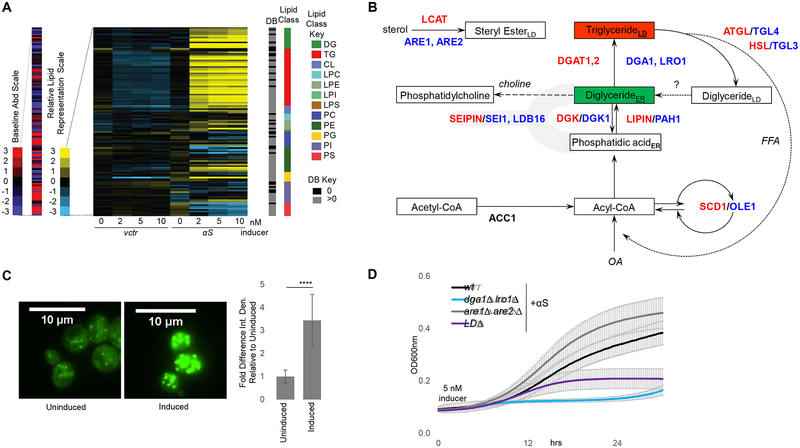
Fig 1– αS expression alters lipid metabolism in yeast. LDs protect against αS toxicity in yeast.
A) Lipid profiles of vector and human αS expression in yeast 12 h post induction. Lipid species (116) indicated by color and in the order of the key. B) Primary pathway for LD formation. DG and TG metabolic pathways are highly conserved between mammals (enzymes-red) and yeast (enzymes-blue). ACC1, cytosolic acetyl-CoA carboxylase; ATGL, adipose triglyceride lipase; DGAT1, 2: diacylglycerol acyltransferases; DGK, diglyceride kinase (multiple isoforms in mammals); OA, oleic acid; HSL, hormone-sensitive lipase; LCAT, lecithin:cholesterol acyltransferase; Seipin, integral membrane protein; SCD1, stearoyl-coA-desaturase; LPIN, lipid phosphatases; ER, endoplasmic reticulum; LD, lipid droplet. Whether lipolysis-derived DG enters the ER is currently unknown. C) αS expression increases LD formation in yeast. Green: BODIPY (LDs). Bar chart: integrated density (ImageJ) fold difference of uninduced vs induced (12h post induction). n = 22/condition. p<0.0005, t-test. D) LDs (TG) protect against αS toxicity. Differences in αS toxicity in 4 different strain backgrounds: (i) wt; (ii) dga1Δ lro1Δ; (iii) are1Δ are2Δ; (iv) LDΔ = dga1Δ lro1Δ are1Δ are2Δ. Samples induced at 5 nM estradiol. Table S2: statistical analysis of all yeast growth curves.

