
Figure 3. Validation of mitochondrial mutations as clonal markers in single cells using lentiviral barcoding.
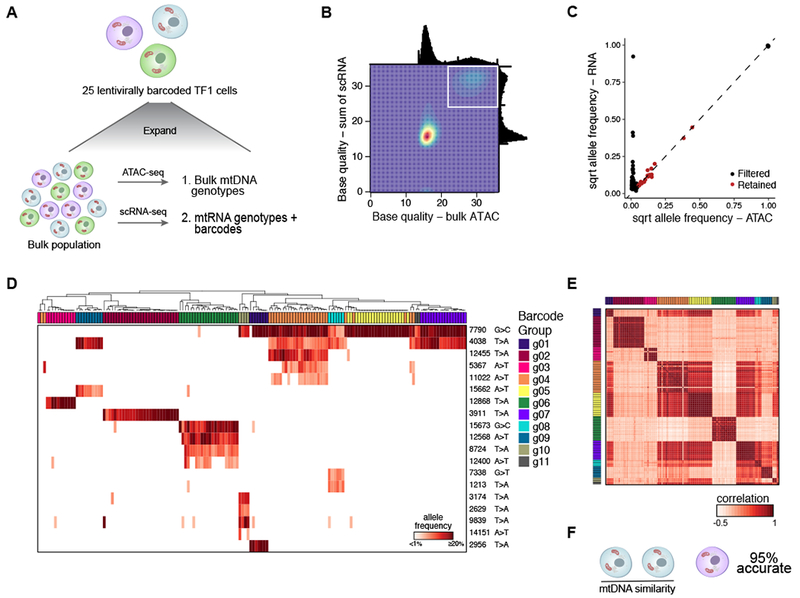
(A) Experimental overview. TF1 cells were infected with a lentiviral vector expressing the mNeonGreen gene and a 30bp random barcode in the untranslated region (Figure S3A). 25 cells were sorted and expanded, followed by bulk ATAC-seq and scRNA-seq. (B) Filtering of high confidence mutations. Base quality (BQ) scores from scRNA- (y axis) and from bulk ATAC-seq (x axis). White box: high-confidence variants detected by both technologies (BQ >20) (STAR Methods). (C) Allele frequencies determined by the sum of single cells from scRNA-seq (y axis) and bulk ATAC-seq (x axis). Black – filtered; red – retained. (D-F) mtDNA inferred clones agree with barcode-based clones. (D) Hierarchical clustering of TF1 mitochondrial genotyping profiles (rows) for cells assigned to annotated barcode groups (columns) (from Figure S3A). Color bar: Heteroplasmy (% allele frequency). (E) Cell-cell similarity from mitochondrial mutations called in (C). Column and rows are annotated by barcode group. (F) Between-group accuracy of identifying the most-similar pair per trio of clones based on mtDNA mutational profile using detected barcodes as a true positive.