
Figure 4. Tissue-specific mitochondrial heteroplasmic mutations.
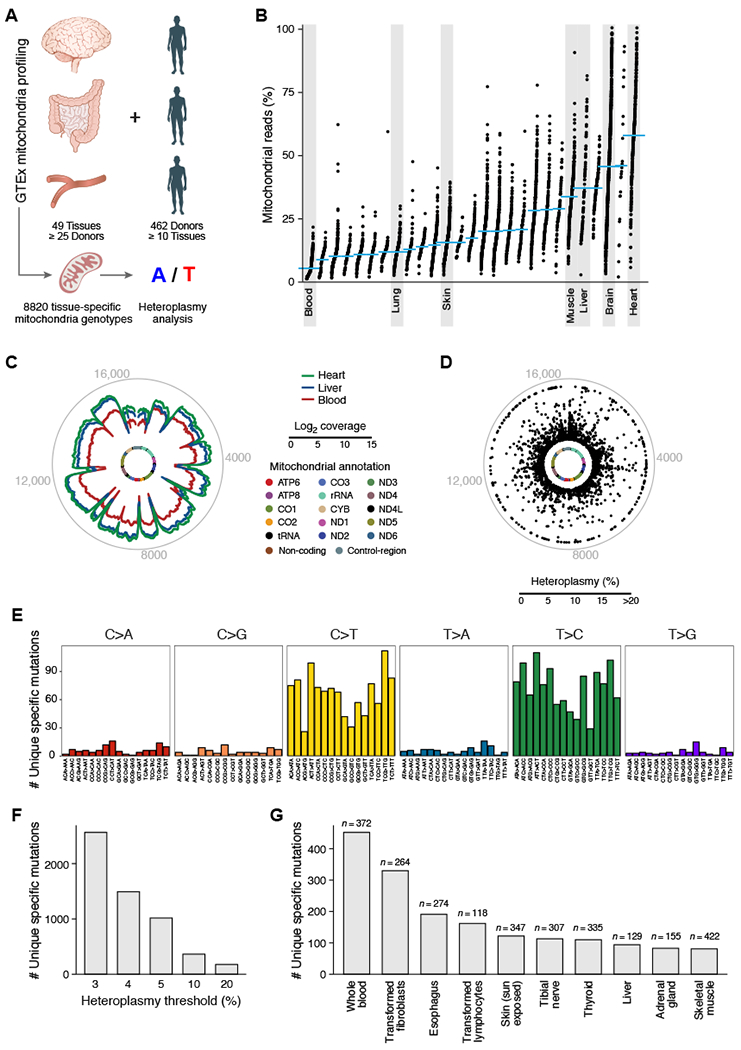
(A) Analysis overview. (B) Proportion of aligned reads that map to the mitochondrial genome for each tissue. (C) Mitochondrial genome coverage for different tissues. Inner circle: mitochondrial genome; middle circular tracks: mean coverage for heart (green), liver (blue), and blood (red); outer grey circle: genome coordinates. (D-G) Tissue-specific heteroplasmic mutations (> 3% heteroplasmy) in GTEx RNA-seq data. (D) Distribution along the mitochondrial genome. Inner circle: mitochondrial genome. Dots: % heteroplasmy of each tissue specific mutation; outer grey circle: genome coordinates. (E) Number of observed tissue-specific heteroplasmic mutations (y axis) in each class of mononucleotide and trinucleotide change. (F) Number of tissue-specific heteroplasmic mutations (y axis) at different allele frequency thresholds (x axis). (G) Number of tissue-specific heteroplasmic mutations (y axis) across the 10 tissues (x axis) with the largest number of tissue specific mutations in GTEx.