
Figure 5. Mitochondrial mutations are stably propagated in primary hematopoietic cells.
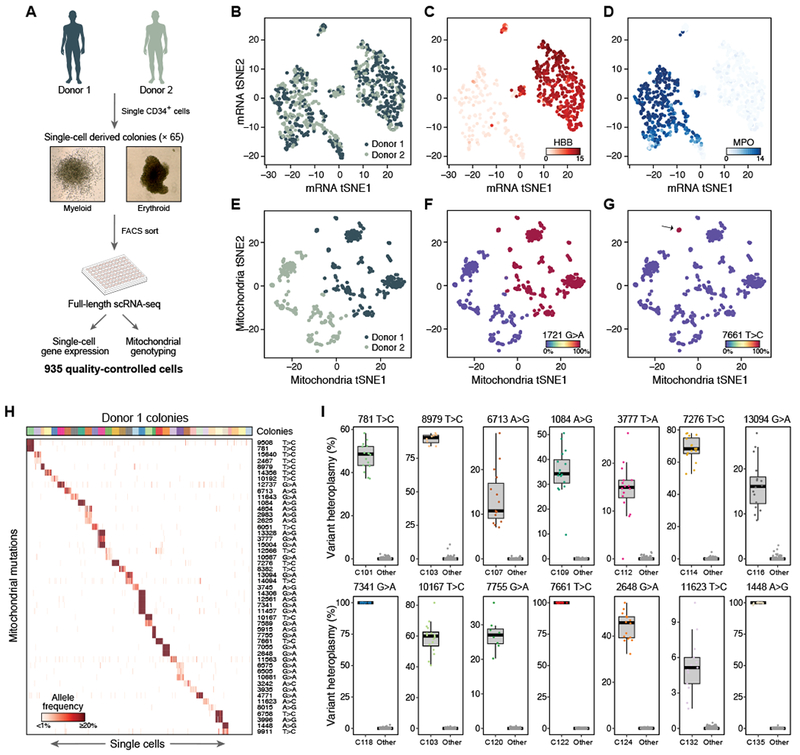
(A) Overview of experiment. Hematopoietic colonies are derived from single primary CD34+ HSPCs in semi-solid media, which were then picked and sorted before performing scRNA-seq. (B-D) Expression profiles separate cells by types and not by donor. t-Stochastic Neighborhood Embedding (tSNE) plots of cells’ expression profiles, labeled by donor (B) or by expression of HBB (C, marking erythroid cells) or MPO (D, marking myeloid cells). (E-G) Mitochondrial mutation profiles separate cells by donor. tSNE plots of mitochondrial mutation profiles, with cells labeled by donor (E), a polymorphic mutation unique to donor 1 (F), or a heteroplasmic mutation present only in a specific colony (G). (H) Colony-specific mutations for Donor 1. Shown are the allele frequencies and base pair change of mutations (rows) that are found by supervised analysis as specific to the cells (columns) in each colony (sorted by colony membership; colored bar on top), color bar: allelic heteroplasmy (%). (I) 14 selected colony-specific mutations in Donor 1 colonies. Box plots show the distribution of heteroplasmy (%, y axis) in cells of a specific colony for the indicated mutation, and in the cells in all other colonies. Dots: individual cells.