
Figure 6. Mitochondrial mutations identify clonal contributions in polyclonal mixtures of human cells.
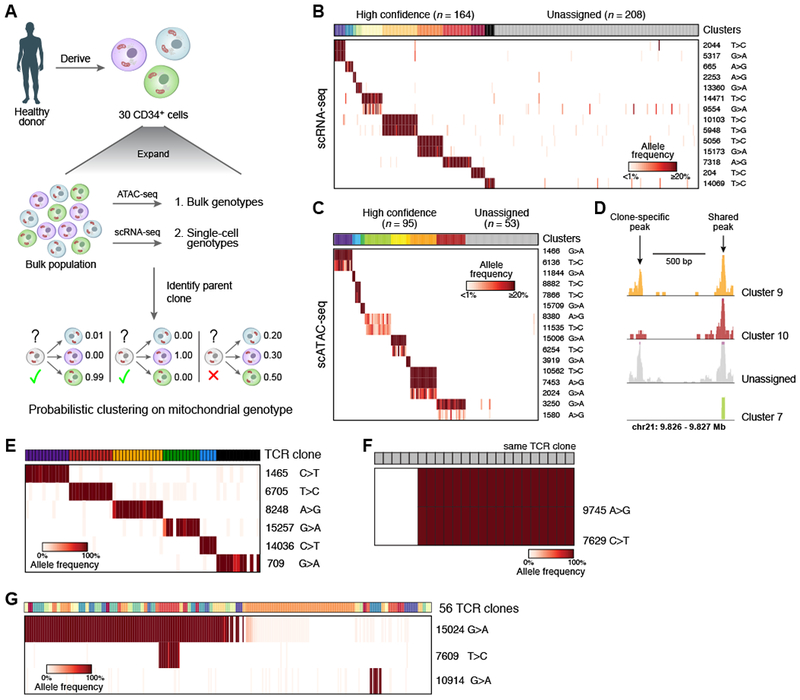
(A-D) Determination of clones in primary hematopoietic cells. (A) Overview of experiment. CD34+ HSPCs are expanded, genotyped in bulk and single cells, and clonal origin is inferred. (B, C) Identification of confident cell subsets based on retained heteroplasmic mutations by unsupervised clustering of scRNA- or scATAC-seq using probabilistic k-medoids. Cells (columns) are sorted by unsupervised clustering on the variants (rows). Clusters: colored bar on top; grey: unassigned cells; color bar: allelic heteroplasmy (%). (D) Example locus with one clone-specific (left) and one shared (right) open chromatin peak recovered by mitochondrial clustering. (E-G) Relationship between mitochondrial mutations and TCR clones in human T lymphocytes. Each panel shows data from independent patients. (E) Shown are the allele frequencies of heteroplasmic mutations (rows) that are concordant with individual TCR clones (columns, color code). (F) Sub-clonal relations within a single TCR clone. Heteroplasmic mutations (rows) that differ between cells within a single TCR clone (columns). (G) Heteroplasmic mutations (rows) shared among a variety of TCR clones (columns, color code). Color bar: allelic heteroplasmy (%).