
Figure 7. Application of mitochondrial mutation tracking in human cancer in vivo.
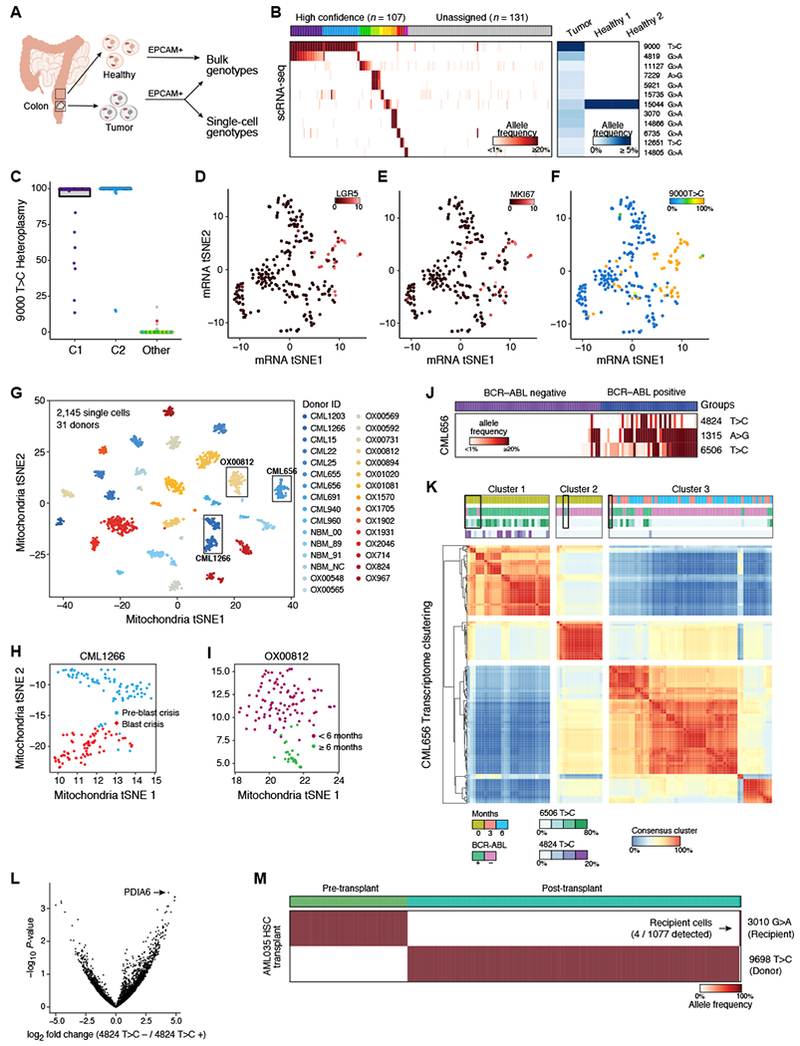
(A-F) Identification of clones in human colorectal cancer. (A) Cells from tumor and adjacent normal tissue are sorted based on EPCAM+ surface marker expression and genotyped using bulk ATAC-seq and scRNA-seq. (B) Identification of clonal subsets based on heteroplasmic mutations (rows) across cells (columns), sorted by unsupervised clustering (clusters: colored bar on top; grey: unassigned cells). Right: allele frequencies in the bulk healthy and tumor populations. (C) Heteroplasmy levels per single-cell. Colors and clusters are from panel B. (D-F) Clone of predominantly LGR5+ cells. tSNE of scRNA-seq profiles from the tumor, colored by expression for (D) LGR5 (E) MKI67 (Color bar: log2 counts per million) and (F) heteroplasmy of the 9000 T>C allele (color bar: % allelic heteroplasmy). (G) Near-perfect separation of donors based on mitochondrial genotypes. tSNE of mitochondrial mutation profiles of 2,145 single cells from 31 donors with CML, colored by donor ID. Boxes: Donors analyzed for sub-clones in (H-L). (H,I) Identification of putative sub-clonal structure within donors. tSNE of mitochondrial mutation profiles of cells from donor CML1266 (H), sampled at pre- (blue) and during (red) blast crisis, and for donor OX00812 (I), sampled at diagnosis and <6 months of treatment (magenta) or >6 months treatment (green). (J) Shown are the allele frequencies of three highly heteroplasmic mutations (rows) across BCR-ABL positive vs. negative cells (columns). Color bar: allelic heteroplasmy (%). (K) Consensus clustering of CML656 transcripts suggests variable annotation in BCR-ABL positive cells at diagnosis. Heatmap showing proportion of times (red/blue) that two cells (columns, rows) belong to the same cluster (STAR Methods). Color bars denote from top to bottom: time of collection, BCR-ABL status, and allele frequencies (6506 T>C, 4824 T>C). Boxes indicate cells where mitochondrial mutations suggest that the BCR-ABL status was incorrectly determined by the BCR-ABL genotyping assay alone. (L) Differentially expressed genes (x-axis) between cells in Cluster 1 comparing cells with and without the 4824 T>C mutation. P-value (y-axis) is from an empirical Bayes moderated t-test. (M) mtDNA mutations distinguish recipient- and donor-specific cells after HSCT in AML. Shown are the allele frequencies of one recipient-specific and one donor-specific mutation (rows) across single cells (columns) collected before and after transplant. Arrow: four recipient cells detected after transplant. Color bar: allelic heteroplasmy (%).