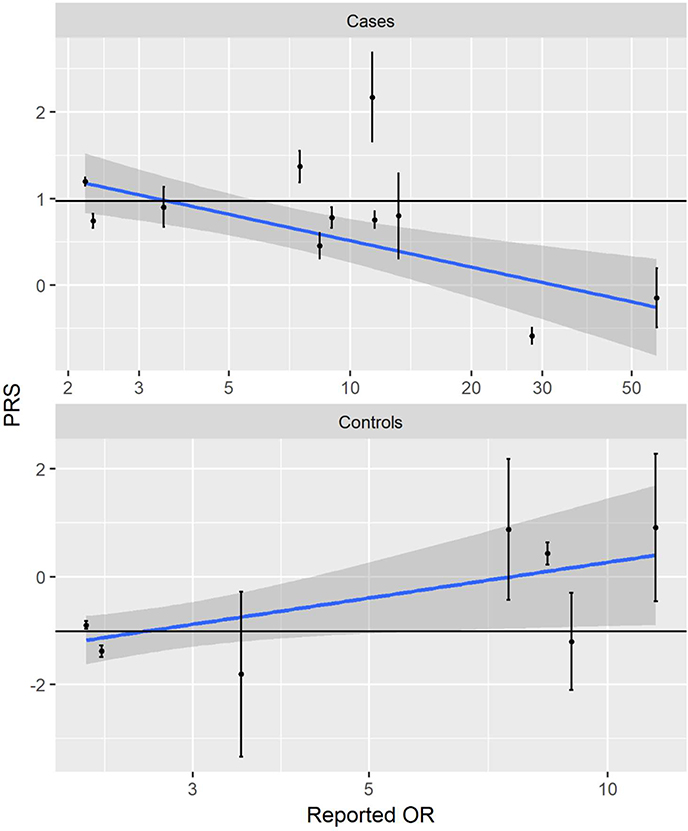
Figure 1:
Plot of PRS against reported ORs among carriers of implicated CNVs, summarized by a linear regression line with a 95% confidence band. The solid black shows the average PRS in non-carriers for comparison.
Top: cases, n = 407, Pearson R = -0.18, p = 2.5E-4
Bottom: controls, n = 115, Pearson R = 0.20, p = 0.20

