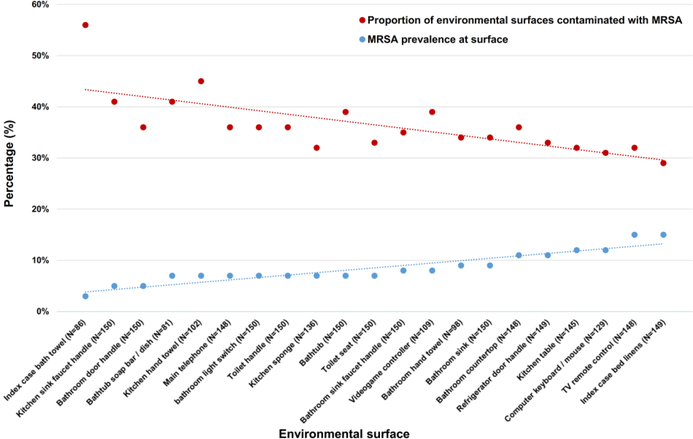
Figure 1.
Prevalence of MRSA contamination at specific surfaces (blue dots/trendline) is inversely related to the proportion of environmental surfaces contaminated with MRSA in households when given surface is contaminated with MRSA (red dots/trendline). Environmental surfaces are listed from left to right in order of increasing MRSA prevalence. When infrequently colonized surfaces (e.g., the index case bathroom towel) are contaminated with MRSA, the proportion of environmental surfaces contaminated with MRSA is high, suggesting these surfaces require a high burden of MRSA in the household prior to becoming colonized. Conversely, the most frequently contaminated surfaces (e.g., the index case bed linens) are contaminated in the context of a low proportion of environmental surfaces contaminated with MRSA, suggesting these surfaces are the first fomites to be colonized (inverse relationship between colonization prevalence and the proportion of environmental surfaces contaminated with MRSA demonstrated via linear regression analysis; β=-0.696, p<0.001).

