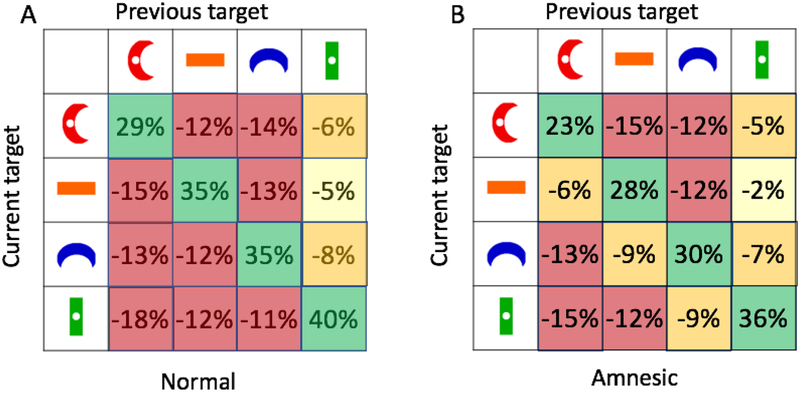
Figure 10:
Transition probabilities between each of the four types of targets in Normal (A) and Amnesic (B) conditions of Experiment 4. Results show the difference in the percentage of actual transitions and the percentage of possible transitions. Thus, if there were 25% blue crescents in the display but they were selected only 10% of the time following a green rectangle, the table would show a −15% difference. Results do not differ significantly between conditions. Colors coarsely code the percentages.

