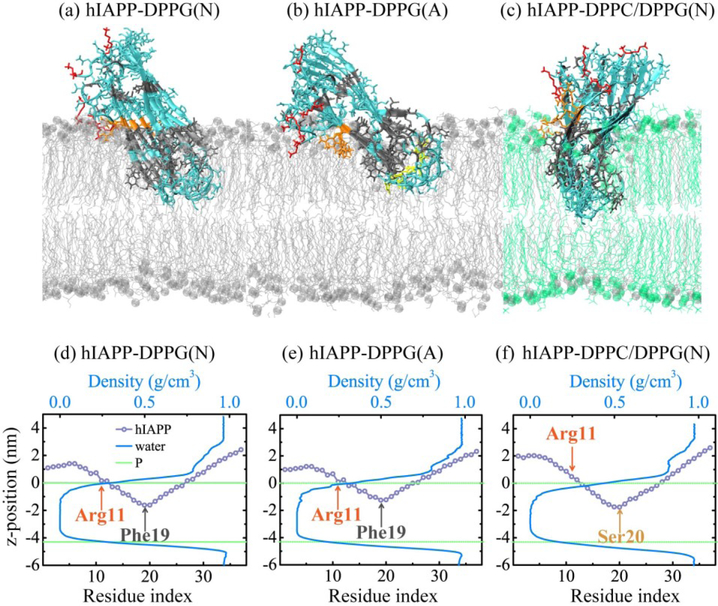
Fig. 4.
(a-c) Snapshots of hIAPP protofibril at membrane interface in a representative MD run of each system. The hydrophilic, hydrophobic, Lys1, Arg11, and positively charged His18 residues are colored in cyan, gray, red, orange, and yellow, respectively; DPPG and DPPC lipids are denoted in silver and green, with phosphorus atoms in spheres. (d-f) Average z-position of each residue of hIAPP protofibirl at bilayer surface and water density profile along the membrane normal for hIAPP-DPPG(N) (d), hIAPP-DPPG(A) (e) and hIAPP-DPPC/DPPG(N) (f) systems. Average z-positions of phosphorus atoms in upper and lower leaflets are denoted by green dashed line.

