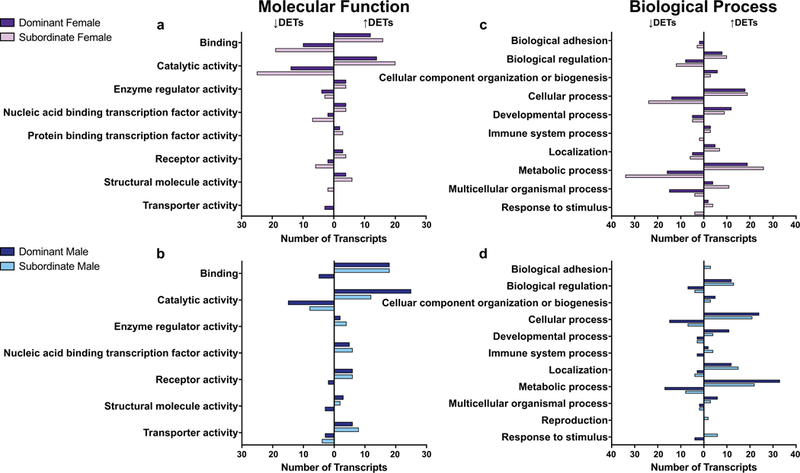
Fig. 4.

GO analysis revealed molecular functions (a, b) and biological processes (c, d) that were represented by the differentially expressed transcripts (DETs) that were higher (bars to the right) or lower (bars to the left) in dominant (dark bars) and subordinate (light bars) animals.
