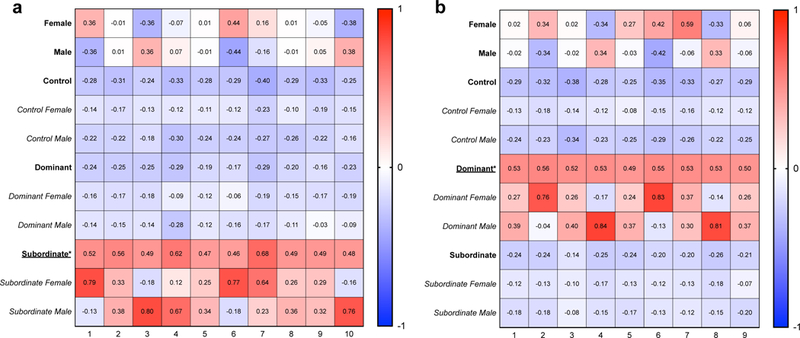
Fig. 6.

WGCNA analysis revealed several gene networks that significantly correlated with social status. 10 modules correlated with subordinate status (a) and 9 modules correlated with dominant status (b). Correlations are reported within each cell, with positive correlations shown in red and negative correlations shown in blue. All 138 modules from WGCNA, along with p-values for each module, are shown in Supplemental Figure 7. Each of the modules shown here had a p-value <0.05 for either subordinate (a) or dominant (b) status (indicated by *). These correlations were primarily driven by one sex, as can be seen in the subcategories below when separated by sex within status.
