Figure 3.
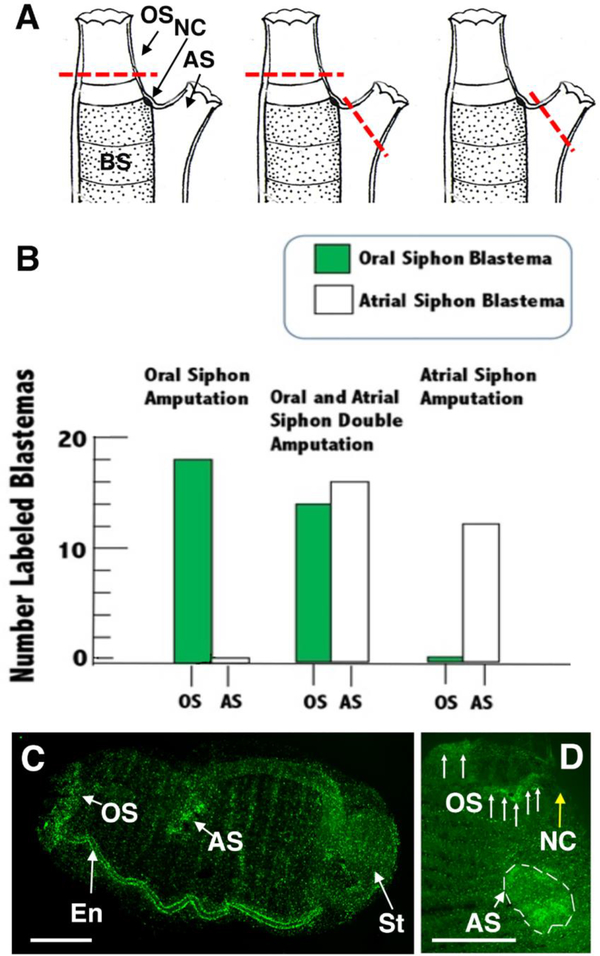
Specificity of progenitor targeting and blastema formation during regeneration of the oral, atrial, or both siphons. A. Diagrams showing the positions of amputation (red dashed lines) in different types of siphon regeneration experiments. Left. oral siphon (OS) amputation. Middle. Oral and atrial siphon (AS) double amputation. Right. Atrial siphon amputation. BS: branchial sac. NC: neural complex. B. Bar graphs showing the numbers of oral and atrial siphons with EdU labeled blastemas after oral (left), oral and atrial (middle), or atrial (right) siphon amputation of the same animals. N of animals with amputated siphons: 18 (oral siphon), 16 (both siphons), and 12 (atrial siphon). C, D. EdU labeled blastema formation following amputation and regeneration of both oral and atrial siphons following a 24 hr EdU pulse and a 2 (C) or 4(D) day chase. C. Fluorescence image showing EdU labeled oral siphon (OS) and atrial siphon (AS) blastemas and labeled endostyle (En) in an entire regenerating animal. The stomach (St) is also labeled (see Jeffery, 2015b). Scale bar: 60 μm. D. Fluorescence image of the distal region of another double amputated animal regenerating both siphons. Arrows indicate parts of oral siphon (OS) blastema and dashed lines indicate atrial siphon (AS) blastema. Scale bar: 40 μm. NC (yellow arrow): neural complex.

