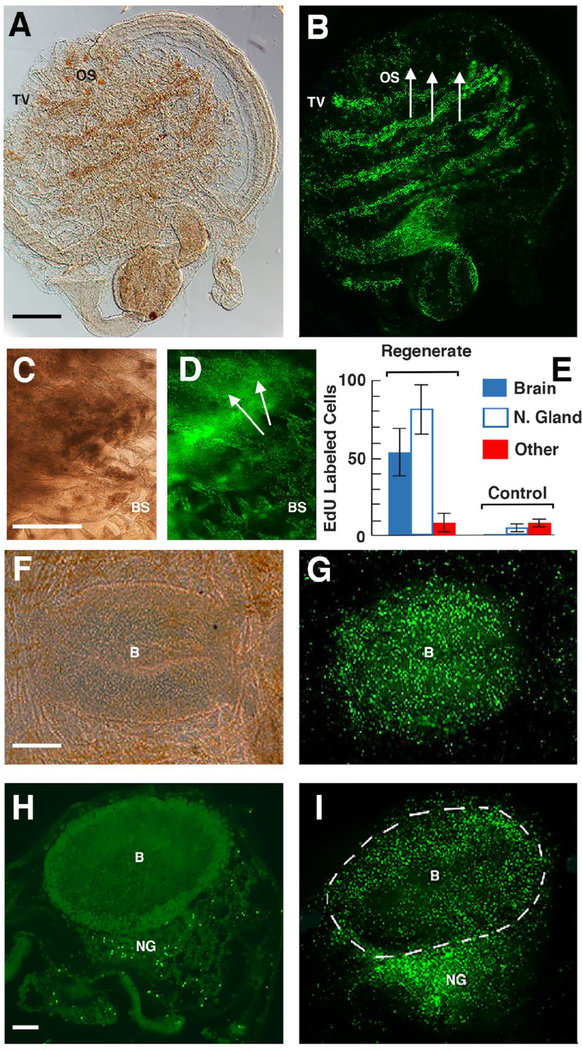
Figure 5.
Branchial sac progenitor cells target the regenerating neural complex. A, B. Lateral views of the same animal after neural complex removal and the standard 24 hr EdU labeling period. OS: oral siphon. Arrows: area of neural complex removal. TV: EdU labeled transverse vessels. Scale bar: 100 μm in A, B. C, D. Dorsal view showing blastema of EdU labeled cells at the site of neural complex ablation (arrows) 5 days after the end of the chase. BS: branchial sac. Scale bar: 40 μm in C, D. E. Quantification of EdU labeled cells in sections of animals with regenerated NC and sham operated controls after 40 days of chase. EdU labeled cells were counted in 400 μm2 areas of the brain, neural gland, and an area outside the neural complex. N of regenerating animals: 8. F, G. N of sham operated controls: 6. Error bars represent SD. Statistics were done by Student’s t tests, resulting in the p values mentioned in the text. F, G. Dorsal view of EdU labeling in the regenerating neural complex following 20 days of chase. B: brain. Scale bar: 15 μm in F, G. H, I. Fluorescence images of EdU labeling in sections of a sham-operated control (H) and an animal with a regenerated neural complex (H) following 40 days of chase. Scale bar: 10 μM in H, I. B: Brain. NG: Neural gland. A, C, F. Bright field images. B, D, G-I. Fluorescence images.

