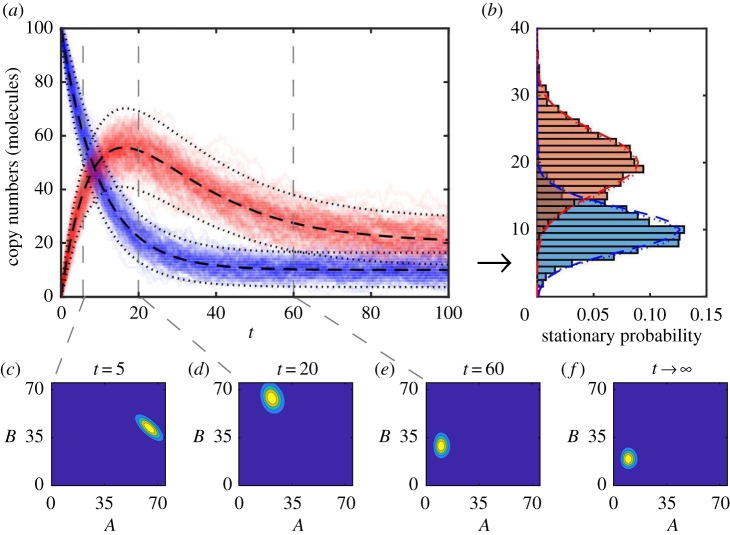
Figure 2.
(a) The chemical master equation mean (black dashed) ± two standard deviations (black dots) of copy numbers of A (blue) and B (red) chemical species are displayed over simulated sample paths to demonstrate agreement. (b) The stationary distributions of A and B computed using: long running, T = 1000, simulated sample paths (blue/red histograms); Gaussian approximation (blue/red dashed) using long time limits of chemical master equation mean and variances; and the long time limit of the full chemical master equation solution (blue/red dots). Transient chemical master equation solution at times (c) t = 5, (d) t = 20 and (e) t = 60. (f) Chemical master equation solution stationary distribution. The parameters are k1 = 1.0, k2 = 0.1, k3 = 0.05, and initial state is A(0) = 100, B(0) = 0. (Online version in colour.)

