Figure 4.
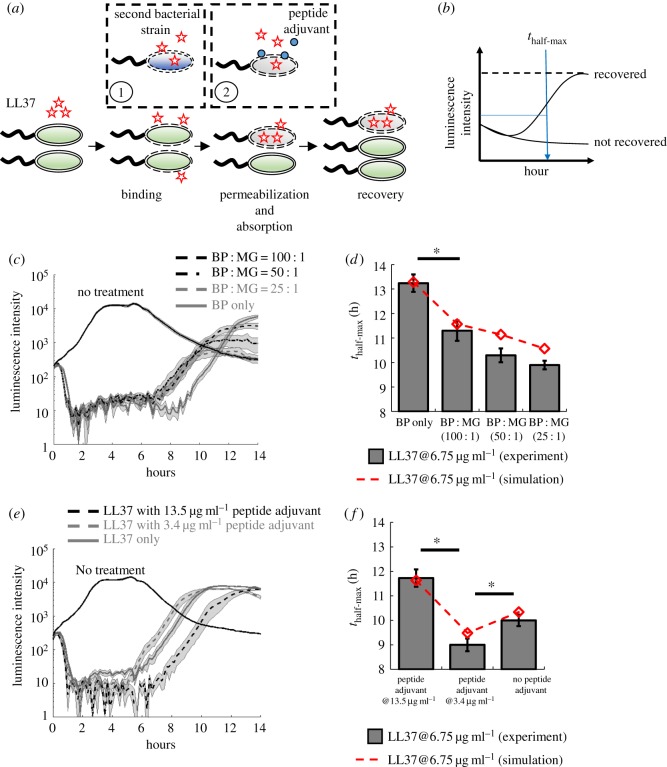
LL37 absorption by dead cells leads to cross-bacterial strain protection and can be reduced by a peptide adjuvant. (a) The perturbations of AP absorption by another bacterial strain (①) or a competitive molecule for absorption (②). Specifically, one bacterial strain may have different LL37 absorbing kinetics (e.g. faster absorption rate) that modulate recovery of another strain during AP treatment. In addition, a peptide adjuvant that can compete with LL37 for unintended AP absorption may increase the antibacterial efficacy of LL37. (b) We evaluate the recovery of the bacterial population under AP treatment using the time when the population recovers to half of its maximum growth capacity within 14 h. (c,d) Two strains of E. coli (BP-lux and MG1655) are mixed at different ratios, where the total CFU of each mixture is kept constant. (c) Dynamic curves show the cross-bacterial strain protection. In the presence of MG1655 (black dashed and grey dashed lines), the recovery times of BP-lux (which is tracked through luminescence intensity) are shifted to an earlier time than the one with only BP-lux (grey line). Shaded error bars are s.e.m. from N = 8. (d) Quantified recovery times from experiment (grey bars) and simulation (dashed line) showing cross-bacterial strain protection (see electronic supplementary material, method S14, for the model, and electronic supplementary material, table S1, for estimated parameters). Asterisk indicates significant difference (p < 0.01), and error bars are s.e.m. from N = 8. See electronic supplementary material, method S18. (e,f) A peptide adjuvant is added to the culture of BP-lux during LL37 treatment. (e) Dynamic curves show perturbation by the peptide adjuvant. The recovery is delayed in the presence of the peptide adjuvant at 13.5 µg ml−1 (black dashed line) but accelerated in the presence of the peptide adjuvant at 3.4 µg ml−1 (grey dashed line) compared with the one with only BP-lux (grey line). Shaded error bars are s.e.m. from N = 8. (f) Quantified recovery times from experiment (grey bars) and simulation (dashed line) (see electronic supplementary material, method S14, for the model, and electronic supplementary material, table S1, for estimated parameters). Asterisk indicates significant difference (p < 0.01), and error bars are s.e.m. from N = 8. See electronic supplementary material, method S19. (Online version in colour.)

