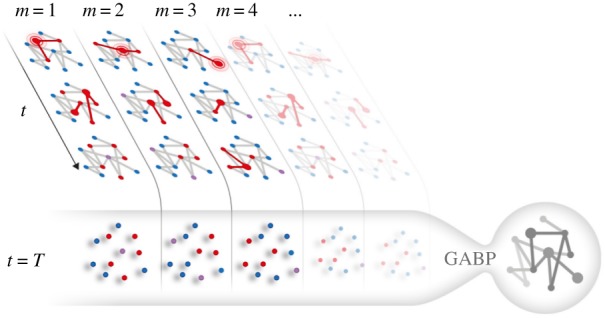
Figure 1.

Cartoon representation of the network reconstruction problem: M independent cascades starting from different sources (highlighted in the first frame of each vertical stripe) are represented, with time flowing downward. Infected nodes are red, susceptible nodes are blue and recovered nodes are purple. The GABP algorithm is provided a set of M snapshots taken T time steps after the cascade onset: the goal is to reconstruct the functional interactions in the network G as well as to identify the source of each cascade. (Online version in colour.)
