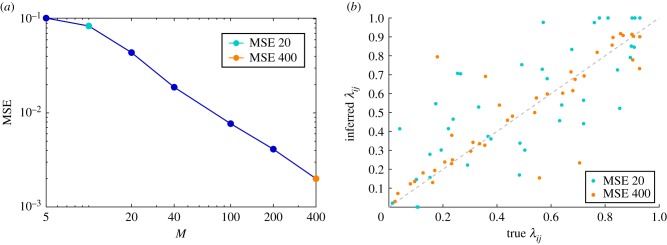
Figure 11.
Reconstructing spreading couplings in inhomogeneous networks. (a) Mean squared reconstruction error in a random regular graph of size |V| = 20 and degree d = 4, as a function of the number of observed cascades M. The network structure is known in advance. The spreading couplings have been extracted randomly from the homogeneous distribution in the interval [0, 1]. The state of the network is observed only at time T = 5 for each cascade. (b) Scatter plot of reconstructed transmission probabilities λij versus true spreading couplings for the cases M = 20 and M = 400, corresponding to the golden and green points in (a), respectively. (Online version in colour.)

