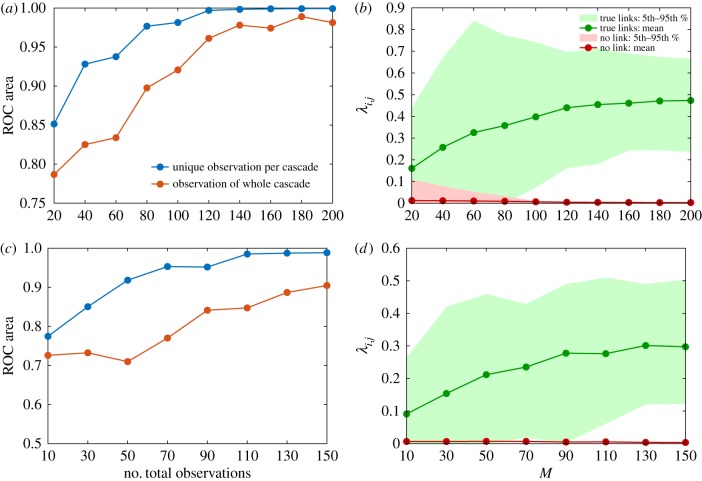
Figure 4.
Reconstruction performance of GABP in the network of retweets (|V| = 96) with increasing number of independent cascades M. Epidemic parameters are λij = 0.5 and μi = 0.4, observation time T = 5. (a,c) Blue curve: area under ROC curve in the case where the state of the networks is fully observed at each time t ∈ {1, …, T} for each cascade m. Red curve: area under ROC curve in the case where the network is observed only at time T in each cascade. (b,d) Average value of λij for true links (green) versus non-existent ones (red) as a function of the number of observed cascades in the standard case (observation at time T only); shaded areas correspond to the intervals between the 5th (10th in (d)) and the 95th (90th in (d)) percentile in each distribution. (Online version in colour.)

