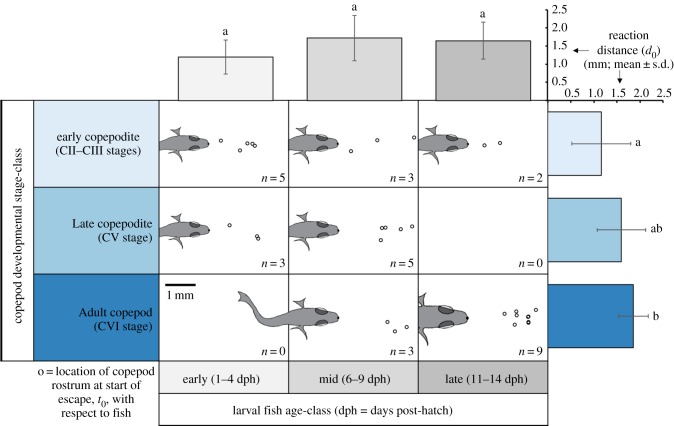
Figure 3.
Relative positions of copepods and fish at t0, just prior to escape, shown in a 3 × 3 matrix of copepod developmental stage-classes (rows) and fish age-classes (columns) (n = number of observations). Fish drawn to scale, showing the average head half-width for each predator–prey category. Bar graphs show means for reaction distance (d0) as a function of copepod developmental stage-class (to the right, in shades of blue) and fish age-class (top, in shades of grey). The results of statistical tests (ANOVA with Tukey multiple, post hoc comparisons) are represented by letters near each bar, whereby different letters indicate significant differences (p < 0.05) between prey stage-classes (no significant differences among fish age-classes). (Online version in colour.)

