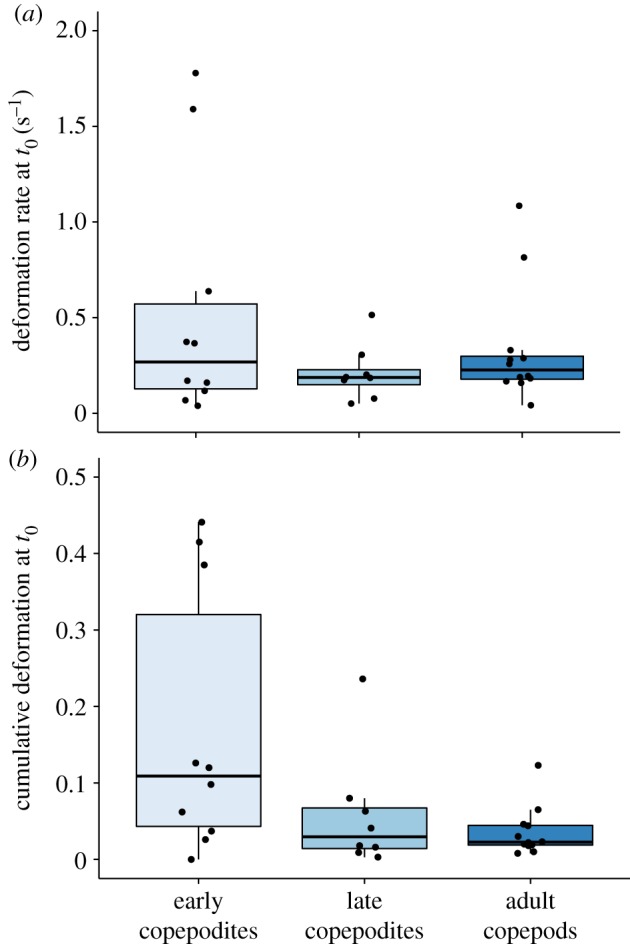
Figure 7.

Deformations calculated by the hydrodynamic model at the moment just prior to escape (t0), displayed as boxplots by copepod developmental stage-class: horizontal lines represent medians for each stage-class, the blue boxes represent the middle 50% of the data, and the vertical lines (whiskers) represent the ranges for the bottom and top 25% of the data, excluding outliers. Points overlaying the boxes represent values for individual copepods within each stage-class. (a) Deformation rate (D; in s−1); (b) cumulative deformation (C; unitless). (Online version in colour.)
