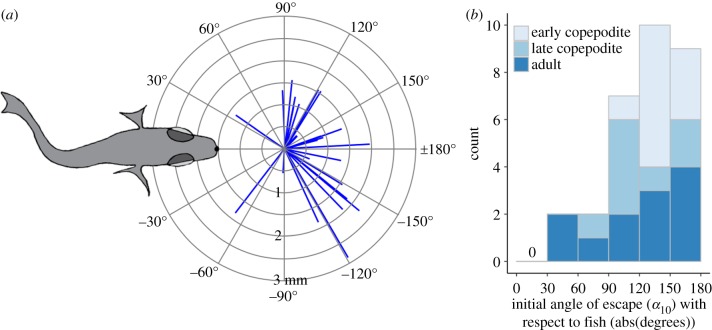
Figure 8.
Directionality of copepod escapes. (a) Initial escape vectors traversed by the copepod (n = 30) during the first 10 ms of escape, referenced to its initial location and direction of approach. The fish is shown at the average reaction distance (d0 = 1.5 mm). (b) Initial angle of escape (α10) shown by copepod developmental stage-class, all as absolute values with respect to the direction of approach. (Online version in colour.)

