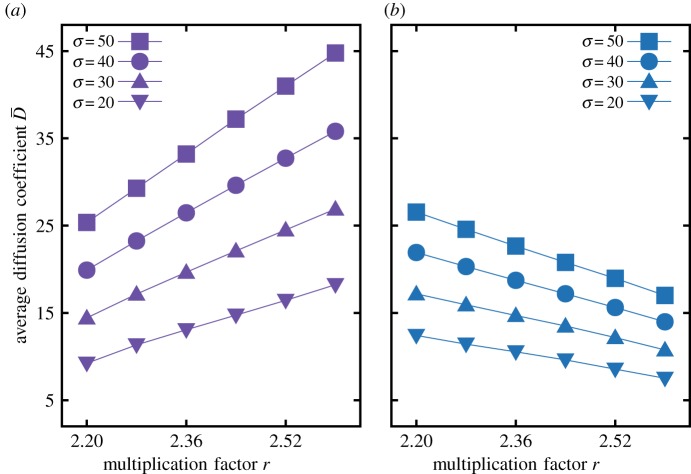
Figure 5.
(a) Bacterial growth, (b) human migration. The average diffusion coefficient against the multiplication factor r at a given σ. Different point symbols represent results of with different σ. Configurations in figure 4 are used for calculating . Solid lines are guidelines for points with the same σ. The average diffusion coefficient increases as r increases for bacterial growth diffusion, while decreases for human migration diffusion. This opposite behaviour over r of two different diffusions makes different shifts of two boundaries between heterogeneous and homogeneous pattern phases for r < rhopf and r > rhopf. For r < rhopf, the boundary under bacterial growth diffusion is located much higher than human migration diffusion, while it is opposite for r > rhopf.

