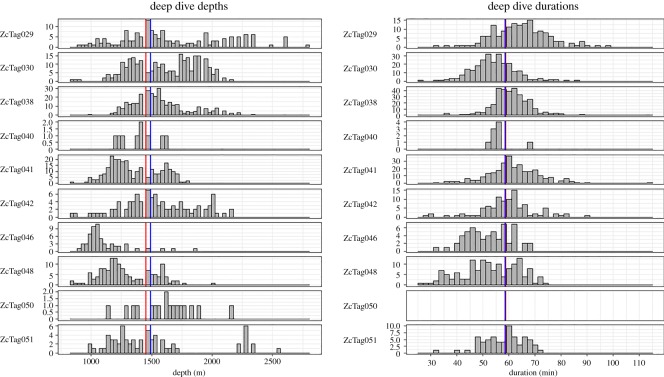
Figure 4.
Histograms of deep dive depths and durations for individual Cuvier's beaked whales. The red vertical line is the median for all animals combined; the blue line is the overall mean. Durations were not calculated for ZcTag050 due to probable errors of undersampling surfacings. The y-axis scale varies between animals.

